


In this report, we recap 2020 and offer our Top 10 List of things for gold investors to watch in 2021.
2020 was a tremendous year for precious metals. Gold bullion gained 25.12%1 in 2020. Silver bullion2 rose 47.89%. Palladium climbed 25.86% and platinum increased 10.92%.7 Gold mining equities increased 21.96% (as measured by SGDM).3 By comparison, the S&P 500 TR Index5 tallied an 18.40% return.
Month of December/Year 2020
| Indicator | 12/31/2020 | 11/30/2020 | Change | Mo % Chg | 2020 % Chg | Analysis |
| Gold Bullion1 | $1,898.36 | $1,776.95 | $121.41 | 6.83% | 25.12% | 8th best annual return since 1970 |
| Silver Bullion2 | $26.40 | $22.64 | $3.76 | 16.60% | 47.89% | 6th best annual return since 1970 |
| Gold Senior Equities (SGDM)3 | $30.50 | $29.57 | $0.93 | 3.46% | 21.96% | Robust financials, record low valuations |
| Gold Junior Equities (SGDJ)3 | ||||||
| Gold Equities (GDX)4 | $36.02 | $34.68 | $1.34 | 3.86% | 23.02% | (same as above) |
| DXY US Dollar Index5 | 89.94 | 91.87 | (1.93) | (2.10)% | (6.69)% | Major top in place |
| S&P 500 Index6 | 3,756.07 | 3,621.63 | 134.44 | 3.71% | 16.26% | New all-time high close |
| U.S. Treasury Index | $2,559.40 | $2,565.34 | (5.94)% | (0.23)% | 8.00% | ZIRP, open-ended QE, AIT and more |
| U.S. Treasury 10 YR Yield | 0.91% | 0.84% | 0.07 | (8.86)% | (52.38)% | Biggest % drop since 1961 |
| U.S. Treasury 10 YR RealYield | (1.09)% | (0.96)% | (0.13) | (13.28)% | (942.59)% | Biggest % drop since 1998 |
| Silver ETFs (Total Known Holdings ETSITOTL Index Bloomberg) | 885.89 | 871.46 | 14.44 | 1.66% | 45.98% | 280 mil oz added, 2x previous high |
| Gold ETFs (Total Known Holdings ETFGTOTL Index Bloomberg) | 106.76 | 107.67 | (0.91) | (0.85)% | 28.75% | 23.8 mil oz added, most ever |
2020, A Year Unlike Any Other
Spot gold closed at $1,898, an increase of $381/oz or 25.12%, the eighth-best annual return in 50 years. Gold, measured in every currency, made all-time highs by a wide margin. The impact of the global COVID-19 pandemic catalyzed the U.S. Federal Reserve (Fed) to support the most extreme measures of unorthodox money policy yet. We have moved to MMT (modern money theory) style policies, zero interest rate policies (ZIRP), QE (quantitative easing) Infinity, average inflation targeting (AIT), outcome-based forward guidance, numerous credit facilities and swap lines, and we expect more to come. Gold is the primary beneficiary of this Fed action and continues to outperform the market's main equity and bond asset classes.
As this new year unfolds, we see gold continuing to perform well and exhibiting the unique characteristics that will further increase gold's attractiveness in multi-asset portfolios.
Figure 1A. 2020 Was a Banner Year for Precious Metals Investments

Figure 1B. Gold Outperforms Major Asset Classes: Long-Term Chart (12/31/1999-12/31/2020) 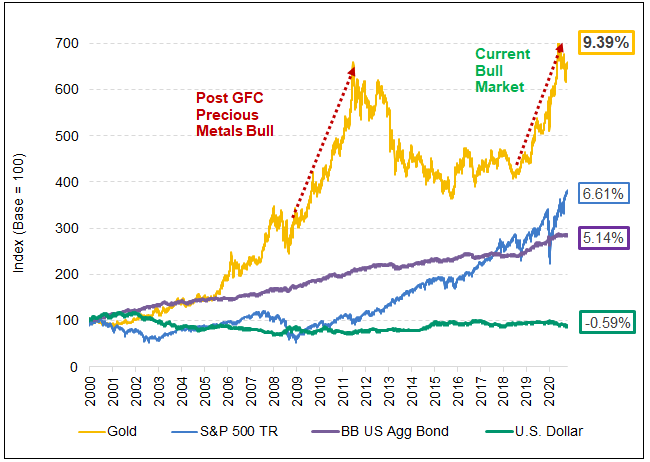
Source: Bloomberg. Gold is measured by GOLDS Comdty; silver is measured by spot silver; palladium is measured by spot palladium; platinum is measured by spot platinum; S&P 500 TR is measured by the SPX; US Agg Bond Index is measured by the Bloomberg Barclays US Agg Total Return Value Unhedged USD (LBUSTRUU Index); and the U.S. Dollar is measured by DXY Curncy. You cannot invest directly in an index. Past performance is no guarantee of future results.
2020 will likely be considered a watershed year in the history books, especially for financial markets. The year began with the broad markets marching relentlessly higher despite signs of an economic slowdown and a malfunctioning repo market (repurchase agreements are critical in allowing companies to borrow short-term cash cheaply). By late January, COVID was spreading unchecked across the globe and accelerating. An initial wave of lockdowns helped slow the spread of the virus, but economies everywhere came to a halt overnight. The global flow of U.S. dollars collapsed, a funding-shortage crisis ensued and market liquidity stress exploded. Capital markets spiraled into a full-blown liquidity crisis in a matter of weeks. Funds were forced to deleverage aggressively as volatility spiked. Market depth vaporized, resulting in one of the fastest and deepest drops equity markets have ever recorded, exposing the degree of fragility and lack of depth in the broad equity market.
March COVID Madness
March 2020 will go down in history as one of the most tumultuous ever for capital markets. For the first time in more than 100 years, a pandemic struck with devastating results, representing a global health crisis not seen since the 1918 worldwide influenza pandemic. The series of cascading events precipitated by the COVID pandemic, including the full-blown liquidity crisis, saw the Fed finally arrive at zero interest rates (ZIRP), QE Infinity, and the re-opening of virtually every emergency credit and swap facility last seen during the GFC (global financial crisis). The fiscal response was equally stunning, with a more than $2 trillion stimulus package from the U.S. alone in March. Globally, the monetary and fiscal response has dwarfed the GFC response.
During most of this period, gold worked well as a hedge in times of financial stress except for two weeks in March as the liquidity crisis became so severe that it forced the selling of gold to meet margin calls and collateral obligations. Even the U.S. bond market, the largest, most liquid financial asset, malfunctioned badly during this liquidity crisis.
Gold Reaches New $2,064 High in August
With the massive fiscal stimulus, QE Infinity, global U.S. dollar swap lines and credit, every asset class began to normalize through spring. Though the enormous monetary and fiscal packages produced a remarkable recovery in the financial markets, the real economy remained in an unequal recovery, and employment levels are still struggling. Globally, there has been an estimated $8 trillion of QE plus another $14 trillion of fiscal stimulus in 2020.
By August, gold, measured in every major currency, had reached new highs, with gold in U.S. dollar-terms touching an all-time intraday high of $2,075 (a closing high of $2,064). As the global money supply surged and central banks' balance sheets reached astounding levels, real yields plunged along with the U.S. dollar (USD). Silver touched a high of $29.86 (a closing high of $28.18). The market had begun to price in the long-term nature of money supply growth, persistent deep negative real interest rates and the need to weaken the USD.
In the September 15-16 Federal Open Market Committee (FOMC) meeting, the Fed policy framework had a significant move to an "outcome-based forward guidance" and an "average inflation targeting" (AIT) of 2%. The takeaway is that the Fed Funds rate will stay at 0% for a very long time. This meant that future rate hikes will occur only by achieving "maximum employment levels" as defined by the Fed. Effectively, this means a negative real interest rate policy. Not only will the Fed policy remain accommodative even after economic lift-off, but it will be asymmetrical as the Fed will only respond to an inflation shortfall (ignore overshoots, boost if it undershoots). The implications for gold have been incredibly positive.
An Election for the History Books
After an incredible move in gold bullion, selling began around the September quadruple witching period. September's OpEx (options expiration) had more events than usual, but the U.S. election became the overriding risk factor. The broader market had reduced positions and bought expensive "crash-type hedges" in size in anticipation of a chaotic U.S. election day extending into Inauguration Day. Instead, Election Night gave the market an ideal bullish result: A clear presidential winner, no domestic crisis and a split government. The large quantity of expensive crash protection hedges was then forced to unwind, creating a short squeeze and fueling buying as the market moved higher. The Pfizer-BioNTech COVID-19 vaccine news came on December 2 and ignited the reflation rotation trade; a quicker economic recovery was now possible.
Yearend Marked by Irrational Exuberance
It was a one-sided trade gone very wrong and forced funds to reposition. Every safe haven investment (bonds, cash and gold) was reduced with the proceeds redeployed towards the reflation trade. Spot gold briefly fell below the $1,800 level and the 200-day moving average due not to any significant deterioration in macro fundamentals but by an extreme shift in market expectations and positioning.
As 2020 closed, broad markets were reaching new all-time highs, valuations firmly in dot-com bubble levels, overbought conditions, put-call ratios at all-time lows and sentiment at euphoria levels. The consensus outlook for GDP (gross domestic product) growth, inflation, yields, and earnings growth can be best described as "Goldilocks." The market has looked past the current negative news and to a much brighter future (and then some).
The top 10 things for gold/precious metals investors to watch in 2021:
#1. Fiscal Policy and Inflation Expectations
#2. Policy Makers: Favor Capital or Society?
#3. Volatility Movements and Gold
#5. U.S. Money Supply Growth and Gold Relationship
#6. U.S. Dollar Secular Top Forming
#7. 10-Year Real Yields Heading Lower
#8. Gold Equities at Extreme Attractive Valuation Metrics
#10. Platinum Emerging from a Long Bear Slumber
We break up our Top 10 Watch List into three categories: A) Developing Long-Term Macro Trends; B) Macro Factors to Watch; and C) Investment Ideas.
Part A: Developing Long-Term Macro Trends
#1. Fiscal Policy and Inflation Expectations
The return of former Fed Chair Janet Yellen will support the fiscal-monetary partnership to develop further. During her tenure as Fed Chair and in recent communications, Yellen has long advocated for more fiscal stimulus. With Yellen, a former Fed Chair, as the new Treasury Secretary and the lines between the Treasury function and central bank function will start to meld towards a harmonized debt-monetization of fiscal spending. As of January 5, the Democrats have taken control of the Senate with two senate victories in Georgia.
For better or worse, we were already on the path to MMT; the only question is how quickly and to what degree will this accelerate?
QE was the primary stimulus tool in the past decade by purchasing bonds to engineer a growth outcome. QE was generally ineffective in boosting the real economy as most of the money printed was trapped in the financial system (creating asset bubbles) while leading to the collapse of the velocity of money (no inflation). Direct funding of fiscal policy that bypasses the banks and puts money into the hands of people who have a propensity to spend will likely increase the velocity of money. It will also have the potential to create inflation. We would keep an eye on inflation expectations.
For gold, the implications are clear. Fiscal spending will increase, and it will be financed more directly. Money supply, the denominator of all financial assets, will continue to soar. The Fed will suppress nominal interest rates and real yields will be forced lower still. The USD will continue to decline and the Fed has prepared conditions to weaken the USD without disrupting the financial system (i.e., USD swap lines).
#2. Policy Makers: Favor Capital or Society?
COVID exposed the fragility of U.S. social and economic systems. This fragility was first brought to the forefront during the GFC. Since then, all the monetary and fiscal responses have not restored any semblance of balance; it has only bought us time. In the absence of a practical solution, problems tend to compound over time, as we have witnessed. The Biden Administration will likely initiate policies that will try and isolate the economic crisis from societal issues. For the past few decades, policies have generally favored capital. Monetary policy has now clearly shifted to favoring social outcomes. We wait for clarity on Biden's fiscal policies, but it seems it will considerably lean towards favoring society.
In 2020, the Fed moved towards outcome-based forward guidance and average inflation targeting (AIT) to raise employment levels in the low to moderate-income households. When Powell was named Fed Chair in 2017, the Fed saw financial excesses as the main risk to the economy and begun the process of shrinking the balance sheet and raised nominal and real yields that nearly crashed the market in Q4 2018. This complete shift in priority from financial excess to focusing on full employment and AIT is nearly the opposite of the Fed's reactions in the past few decades. The Fed had always given in to market demands, fearing a market tantrum or worse, a crash. The consequences of COVID have forced the Fed to favor employment and growth at the expense of inflation and inflated markets.
If the Fed holds to this new course, a dramatic re-pricing of assets is likely, and gold should benefit the most, and bonds the least. Corrections will likely be quick and intense. The market has had its way for decades, and this behavior is embedded. There will be tantrums.
#3. Volatility Movements and Gold
In the past few years, the Fed's suppression of volatility and volatility-selling by funds to generate yields resulted in a build-up of systemic risk. Volatility cannot be eliminated; it can only be delayed, transferred or transmuted. The suppression of volatility is eventually released as a tail event (i.e., an event with only a small probability of happening). We have seen expressions of this volatility pattern. For months on end, day-to-day volatility stays at seemingly impossible low levels (steady linear return profile) only to explode higher shockingly and devastatingly, wiping out a significant portion of those steady gains quickly (tail risk event). Diversification and hedge-type assets behave in a near opposite manner, seemingly ineffective until prices surge suddenly and re-price quickly higher (convex return profile). We expect these prominent-tailed volatility expressions to continue and perhaps accelerate.
A core gold bullion holding will become more critical for more effective hedging and diversification in a multi-asset portfolio. For decades, a bond allocation was an effective hedge driven by the Fed's reaction function to placate markets by slashing yields. Today, allocation to bonds at near-zero or negative yields has become a call on central banks keeping bond prices near-flat. Bonds today, essentially, now provide limited linear returns and almost no convex returns.
In Figure 2, we illustrate this point. The lower panel is a weighted cross-asset volatility index we created using the VIX (equity volatility index), MOVE (bond volatility index) and G7 currency volatility index. When cross-asset volatility is low and steady (lower panel, green ovals), gold tends to trade flat or lower only to surge higher (convex price move) when volatility becomes resurgent. Figure 2 is not a timing indicator but a visual of how gold relates to multi-asset volatility patterns and why an allocation to gold makes so much sense (from a linear/convexity volatility point of view). But it is important to view gold's price in convex terms, not linear. Gold has not been and never will be a day-to-day hedge.
Figure 2. Gold Bullion and Multi-Asset Volatility 
Source Bloomberg. Data as of 1/05/2020.
After the events of 2020, bond markets globally are now not only distorted beyond recognition but are well past the point of no return in allowing the market to price. Essentially, price discovery, a key component of capital market asset pricing, has been short-circuited perhaps permanently. For example, in Europe, the ECB (European Central Bank) has backstopped the yields of Portugal, Italy, Greece and Spain (remember the acronym?) to the point where they now yield significantly less than U.S. Treasury yields (see Figure 3). If these bonds were ever to approach market clearing prices, the losses would be devastating. Much of the increase in negative-yielding bonds are from the Eurozone peripheral nations. In Japan, the same has been occurring, only for much longer. The Bank of Japan (BOJ) is now the largest holder of both government bonds and Japanese equities, and there is no exit plan. We see an equity market mania in the U.S., record corporate debt levels at record low yields and record-high issuances, and real rates being driven lower across the curve.
Central banks have dug themselves into a hole with no apparent escape plan, except to dig even deeper (not a great escape plan). The last central banker that attempted to pull back from this spiral was Fed Chair Powell. After shrinking the Fed balance sheet modestly and raising 10-year real rates to ~1%, the market nearly crashed in Q4 2018. And that was 2018 when the economic and financial situation was significantly better than it is today. That is the plight we are facing. No price discovery can be allowed, and no stepping back for central bankers held hostage by the market.
Record low yields are the only justification for the current dot-com like valuation levels. Furthermore, the systematic funds and quants funds that dominate the equity markets were developed and built in this suppressed volatility environment. There is simply no going back. What logically cannot go on forever needs to go on forever. We expect to see further pricing distortions as central banks continue to dig deeper.
This is an example of tail risk we highlighted in our November Monthly Report, Gold Tests $1,800 Support and why gold as a store of value continues to appreciate.
Figure 3. 10-Year U.S. Treasury Yields, Price Distortion 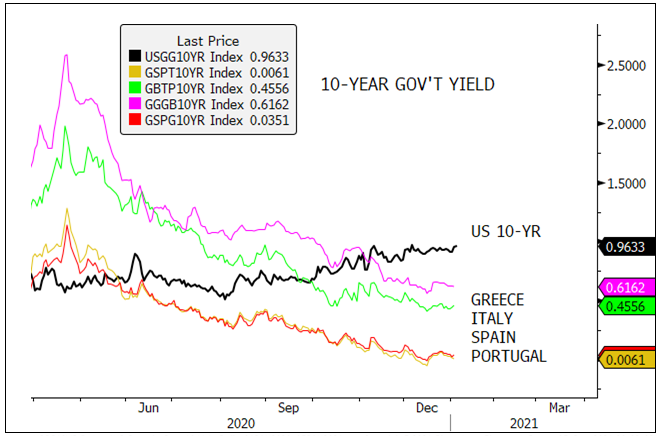
Source Bloomberg. Data as of 1/05/2020.
Part B. Macro Factors to Watch
#5. U.S. Money Supply Growth and Gold Relationship
Gold and money supply have a long and pronounced relationship since the end of Bretton Woods (gold to fiat).8 In Figure 4, we plot the monthly relationship of gold bullion and U.S. M2 money supply9 going back to 1970. The R-squared10 is about 82% during this period, an excellent fit.
Taking a simplistic approach and assuming all else is equal (which will not happen), we can derive a rough estimate of how the likely impact of much higher fiscal spending will impact gold pricing. The recent stimulus bill of $900 billion passed would translate roughly into an increase of $146/oz for gold in time (Y=0.0987 x M2 + 57.207). We are assuming all the $900 billion will be monetized. The possibility of balanced budgets is remote and we are on the road to MMT with the highest debt-ratio in history. There will likely be sizeable fiscal spending programs soon, as mentioned earlier.
In Figure 5, we highlight the incredible growth rate of U.S. M2 money supply, which is currently running at +25% on a 12-month rate of change basis. This represents more than three times the long-term growth rate of 7% and is well over twice the rate seen during the GFC. M2 growth rates are unlikely to fall back to normal levels.
Gold remains well supported by this one factor alone.
Figure 4. Long-Term Relationship Between Gold and U.S. M2 Money Supply
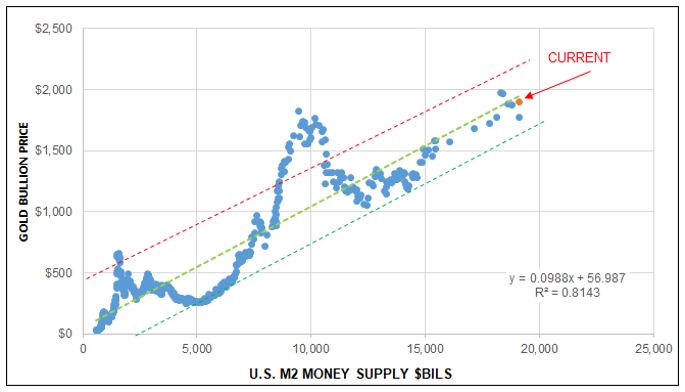
Source Bloomberg. Data as of 1/05/2020.
Figure 5. Growth Rate of U.S. M2 Money Supply 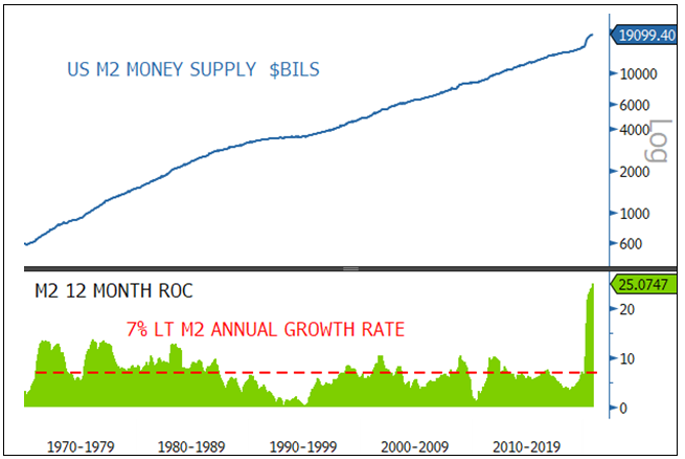
Source Bloomberg. Data as of 1/05/2020.
#6. U.S. Dollar Secular Top Forming
The Fed's goal remains to keep financial conditions loose by increasing inflation expectations while holding nominal yields relatively flat to drive real rates even more negative-yielding. With increasing fiscal expenditures, this combination will keep the USD under pressure. Other factors are helping maintain a weaker USD. The Euro has strengthened as the EU has gotten its act together on the fiscal front. There is an estimated $12 to $13 trillion of USD -denominated debt held by foreign holders. As the global outlook improves, there is a less dire need to hoard U.S. dollars. The Fed announced an extension of the central bank dollar repo and swap lines to Sept 2021. This guarantee of ample USD supply will likely keep a lid on a safe-haven squeeze into USD, reducing a right tail risk repeat of the March USD-driven-funding squeeze and liquidity stress.
The USD faces several domestic headwinds as well. There is an expected heavy U.S. Treasury issuances, divisive U.S. politics, social unrest, higher spending under a Democratic sweep and the growing twin deficits. At the shorter end of the real yield curve, which impacts USD more, there is additional room for deeper negative short-term yields. The introduction of AIT and outcome-based forward guidance will affect the shorter end of the curve more. None of the arguments for a weaker USD is short term in nature; we expect USD weakness to be long term.
Figure 6 shows that the DXY (U.S. Dollar Index) has broken its nine-year rising trend and is now shaping a massive potential double top. A break below the 88/89 level will trigger the double top and open the downside target of 79/80 first and then the full projection target of 75. The breakdown in 2020 appears to be only the first leg of a developing major secular bear market for the U.S. dollar.
Figure 6. DXY (U.S. Dollar Index) is Shaping a Secular Topping Pattern 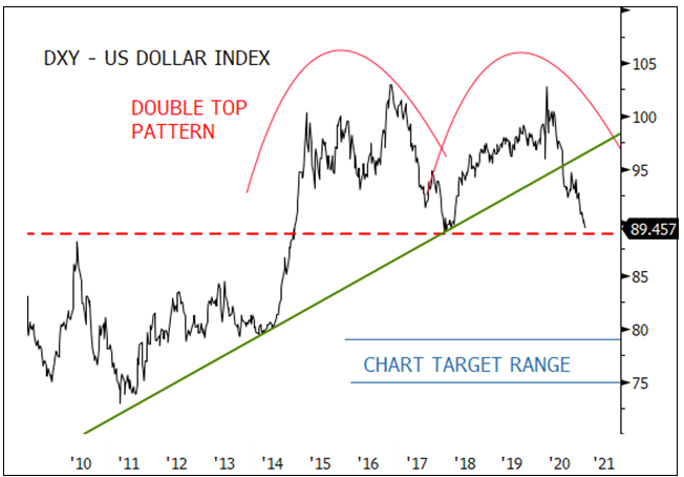
Source Bloomberg. Data as of 1/05/2020.
#7. 10-Year Real Yields Heading Lower
As the U.S. economy continues to recover, breakeven yields will widen further. If nominal yields stay flat due to Fed actions, real yields will continue to fall. A rising breakeven yield would signal the Fed's inflation initiative is taking hold. Real yields going more negative would further incentivize risk-taking and would further debase debt levels. As a reminder, Figure 2 highlights gold's relationship with real yields. In the past two years, R-squared is 85%. The relationship between gold and real yields is the most consistent and pronounced through almost all periods.
Figure 7. Gold Bullion and 10-Year Real Yields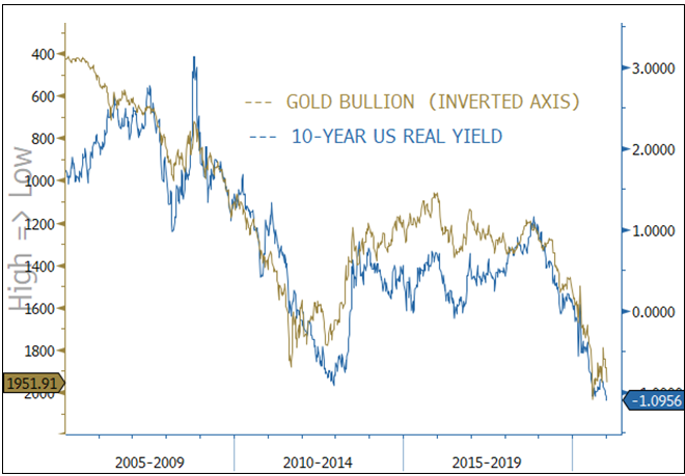
Source Bloomberg. Data as of 1/05/2020.
Part C. Investment Ideas
#8. Gold Equities at Extreme Attractive Valuation Metrics
With the pullback in gold equities in Q4 2020 despite robust Q3 financial results, gold mining equities have reached extremely attractive levels in terms of valuation, financial strength and profitability. In Figures 8 and 9, we highlight some valuation metrics for gold mining equities. In short, they are at some of the most attractive levels based on the historical data from Bloomberg. Using the GDM11 Gold Miners Index as a proxy for gold mining equities, valuations are trading at the low end of EV/EBITDA12 at 15-year lows despite returning 71% in the past two years. The profitability is that strong.
For the gold mining sector, balance sheets are clean and debt levels are at lows (positive net cash). CapEx (capital expenditures) is also near lows. As a result, free-cash-flow yields are at an all-time high and climbing. Return-on-capital and return-on-equity are near the highs. Earnings growth expectations continue to trend higher. Virtually every positive stock factor deemed desirable by investors is near its most attractive historical level. Every negative stock factor is near the low range, creating the widest delta in the risk-reward profile for gold equities in the available data sets.
Figure 8. Gold Mining Equities: Free-Cash-Flow Yields at All-Time Highs, EV/EBITDA at All-Time Lows 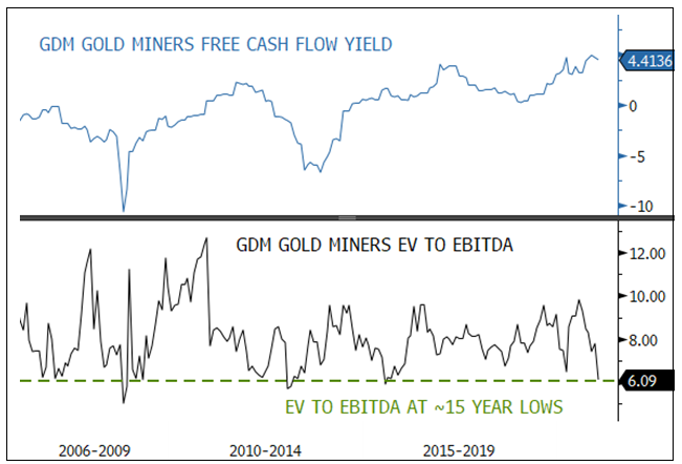
Source Bloomberg. Data as of 1/05/2020.
Figure 9. Gold Mining Equities: Near Record Return on Capital and Clean Balance Sheets 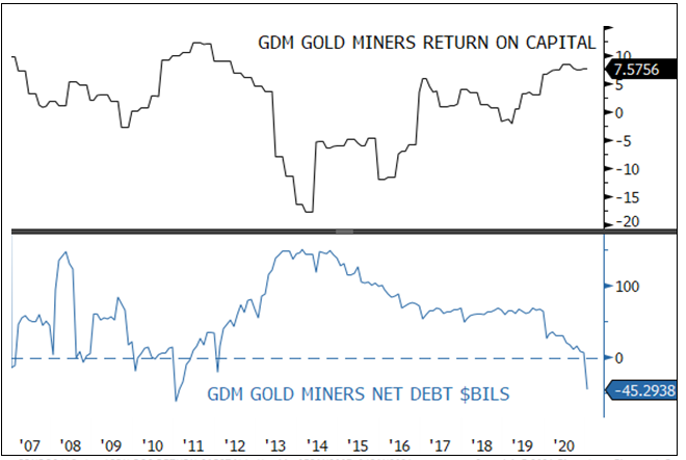
Source Bloomberg. Data as of 1/05/2020.
Silver staged a remarkable rally during the summer of 2020, after lagging the move in gold. Buying in silver ETFs saw its largest yearly increase, more than two times the previous high. Adding to this bullish setup is a significant breakout in the 10-year breakeven yield, signaling a pro-cyclical rotation. The MS Cyclical Index vs. the SP500 ratio has broken out (signaling cyclical outperformance), and the silver-gold ratio is positively correlated to this ratio (76% R-squared weekly last ten years).
Silver has noted industrial and store of value components, making it a unique asset. Silver's correction occurred well above the $21/22 breakout level and the 200-day moving average in a bullish high-level correction (Figure 10, top panel). We expect silver to breakout past the summer highs and enter the $30-35 trading range. The silver-gold ratio is preparing to break out of a cup-and-handle pattern (Figure 10, bottom panel), continuing silver's relative outperformance versus gold bullion.
Figure 10. Silver in a Bullish Setup, Silver-Gold Ratio to Increase Further 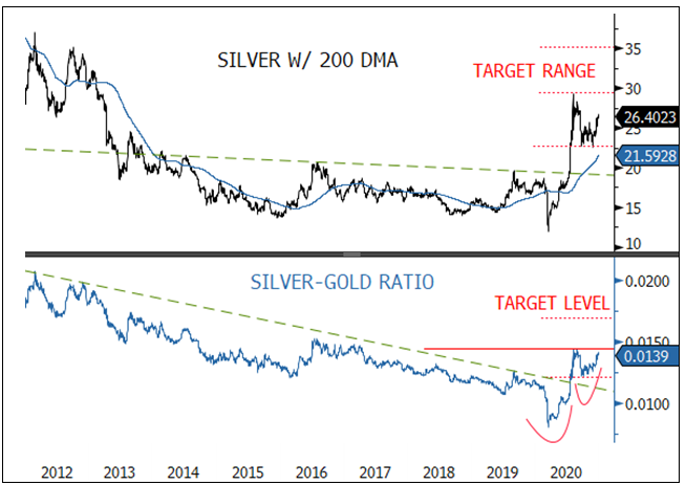
Source Bloomberg. Data as of 1/05/2020.
#10. Platinum Emerging from a Long Bear Slumber
Platinum is emerging from a very extended bear market similar to silver last summer. Since its peak in 2008, platinum had been in a downward channel (blue lines) and had lost half its value. From 2016, while still in the major downtrend, platinum has also been carving out a base (ignoring the COVID blip). Major resistance (and breakout level) is around $1,020 (+/- $20), as marked by the red line. The target price is $1,350 on a successful breakout (upper red dash line). The chart setup is excellent and is one of the most attractive long-term bearish-to-bullish rotations we have seen.
Long term, platinum can be potentially substituted for palladium. Interestingly, the platinum-to-palladium ratio is setting up a pattern similar to 20 years ago. Similar to silver, platinum is positively correlated to pro-cyclical environments. Platinum's 10-year R-squared to copper is 67%, R-squared to silver is 72%, but only an 11% R-squared to gold. We also note that platinum held in ETFs is under massive accumulation, up 63% since the 2019 low.
Figure 11. Platinum Outlook is Very Bullish 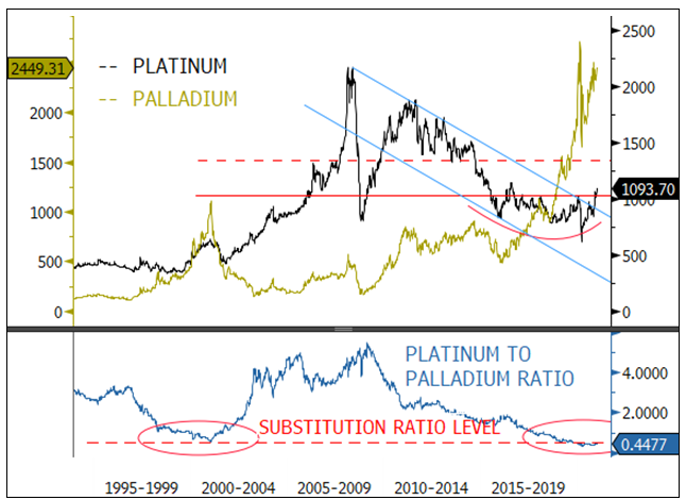
Source Bloomberg. Data as of 1/05/2020.
| 1 | Gold bullion is measured by the Bloomberg GOLDS Comdty Index. |
| 2 | Spot silver is measured by Bloomberg Silver (XAG) Spot Rate. |
| 3 | Sprott Gold Miners Exchange Traded Fund (SGDM) seeks investment results that correspond to the performance the SOLGMCFT Index, which aims to track the performance of larger-sized gold companies. Sprott Junior Gold Miners Exchange Traded Fund (SGDJ) seeks investment results that correspond to the performance of the SOLJGMFT Index, which aims to track the performance of small-capitalization gold companies. |
| 4 | VanEck Vectors® Gold Miners ETF (GDX®) seeks to replicate as closely as possible, before fees and expenses, the price and yield performance of the NYSE Arca Gold Miners Index (GDMNTR), which is intended to track the overall performance of companies involved in the gold mining industry. The SPDR Gold Shares ETF (GLD) is one of the largest gold ETFs. |
| 5 | The U.S. Dollar Index (USDX, DXY, DX) is an index (or measure) of the value of the United States dollar relative to a basket of foreign currencies, often referred to as a basket of U.S. trade partners' currencies. |
| 6 | The S&P 500 or Standard & Poor's 500 Index is a market-capitalization-weighted index of the 500 largest U.S. publicly traded companies. (TR indicates total return and reflects the reinvestment of any dividends). |
| 7 | Tail risk is a form of portfolio risk that arises when the possibility that an investment will move more than three standard deviations from the mean is greater than what is shown by a normal distribution. Tail risks include events that have a small probability of occurring, and occur at both ends of a normal distribution curve. |
| 8 | The Bretton Woods Agreement was negotiated in July 1944. Under the Bretton Woods System, gold was the basis for the U.S. dollar and other currencies were pegged to the U.S. dollar's value. The Bretton Woods System effectively came to an end in the early 1970s when President Richard M. Nixon announced that the U.S. would no longer exchange gold for U.S. currency. (Source: Investopedia). |
| 9 | M2 is a measure of the money supply that includes cash, checking deposits, and easily convertible near money. M2 is a broader measure of the money supply than M1, which includes cash and checking deposits (Source: Investopedia). |
| 10 | R-squared values range from 0 to 1 and are commonly stated as percentages from 0% to 100%. An R-squared of 100% means that all movements of a security (or another dependent variable) are completely explained by movements in the index (or the independent variable(s) you are interested in) (Source: Investopedia). |
| 11 | NYSE Arca Gold Miners Index (GDM) is a modified market capitalization-weighted index comprised of publicly traded companies primarily involved in mining gold and silver in locations worldwide. |
| 12 | The EV/EBITDA ratio is a popular metric used as a valuation tool to compare a company's value, debt included, to the company's cash earnings less non-cash expenses. |
Don’t miss a golden opportunity.
Now that you’ve gained a deeper understanding about gold, it’s time to browse our selection of gold bars, coins, or exclusive Sprott Gold wafers.

About Sprott Money
Specializing in the sale of bullion, bullion storage and precious metals registered investments, there’s a reason Sprott Money is called “The Most Trusted Name in Precious Metals”.
Since 2008, our customers have trusted us to provide guidance, education, and superior customer service as we help build their holdings in precious metals—no matter the size of the portfolio. Chairman, Eric Sprott, and President, Larisa Sprott, are proud to head up one of the most well-known and reputable precious metal firms in North America. Learn more about Sprott Money.
Learn More
You Might Also Like:

Looks like there are no comments yet.