


While we await new stimulus on both the fiscal and monetary front—similar to or in excess of that from March to July—we have to endure the continuation of this slow grind lower in Gold and Silver. However, technical and sentiment indicators signal that precious metals and miners are sufficiently oversold and bearish for the lows to be in place and the next rally to new highs to begin.
10-year real yields are back down to near record lows. So why isn’t Gold rising?
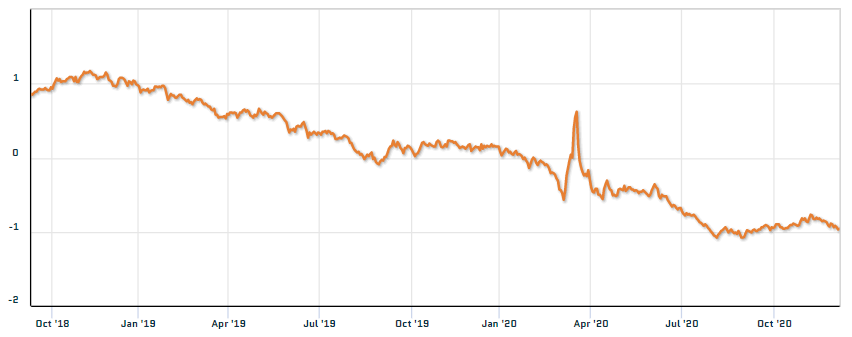
Either real yields have to rise or Gold does. It’s only a matter of time.
The dollar index has continued to dump to its lowest level since April 2018, and yet Gold has been falling alongside it. Again, why?
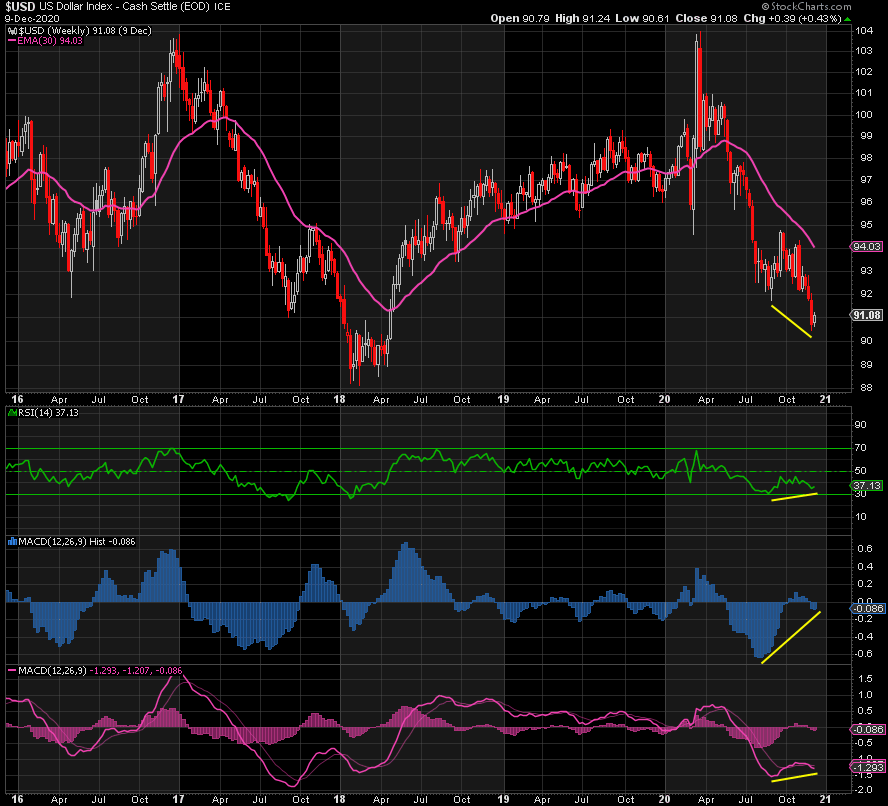
Now we’re seeing positive divergences across all indicators in the dollar index after a significant drop suggesting that the next move is up. Normally, this would mean lower Gold prices, but who knows? Perhaps they rise together next time around. Alternatively, the dollar could just keep falling.
What is clear is that none of this makes much sense. But while the paper prices for Gold and Silver remain under pressure, the availability of the physical metals is becoming scarce yet again, as it did in March. We know this because premiums around the world remain elevated and in many cases are rising. The premium on a 1 oz. Silver Maple Leaf coin is currently ~25% relative to the spot paper price, per one of the biggest bullion dealers in North America. London is seeing even higher premiums depending on the product in question. Several of the major dealers in the U.S. have limited-to-no supply of coins and bars too.
All of this means that while paper prices remain under pressure, physical prices remain relatively flat by comparison. The question is: which will win out, paper or physical? If the rally post March is anything to go by, it will be physical leading the charge higher.
At the end of the day, in the absence of new stimulus, which we are still waiting for, precious metals and miners remain a two-way street from a price perspective. While we wait for that eventuality, technical analysis and Fibonacci levels can provide some guidance on where we’re headed next.
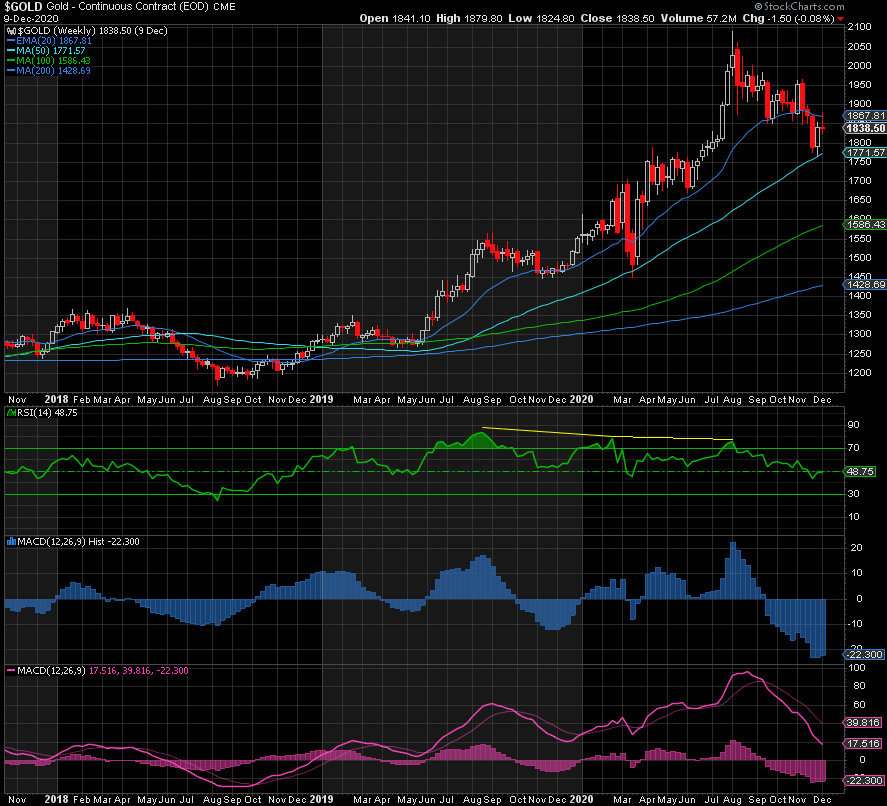
Gold tagged its 50-week moving average perfectly at 1767, which just also happened to be the 50% retracement of the move up from the low of 1451 in March to the peak of 2089 in August. Such confluence is typically a very good indication of a bottom being in place, coupled with extremely bearish sentiment at that low.
That said, there is still room for a positively divergent lower low, especially if real rates and the dollar rise.
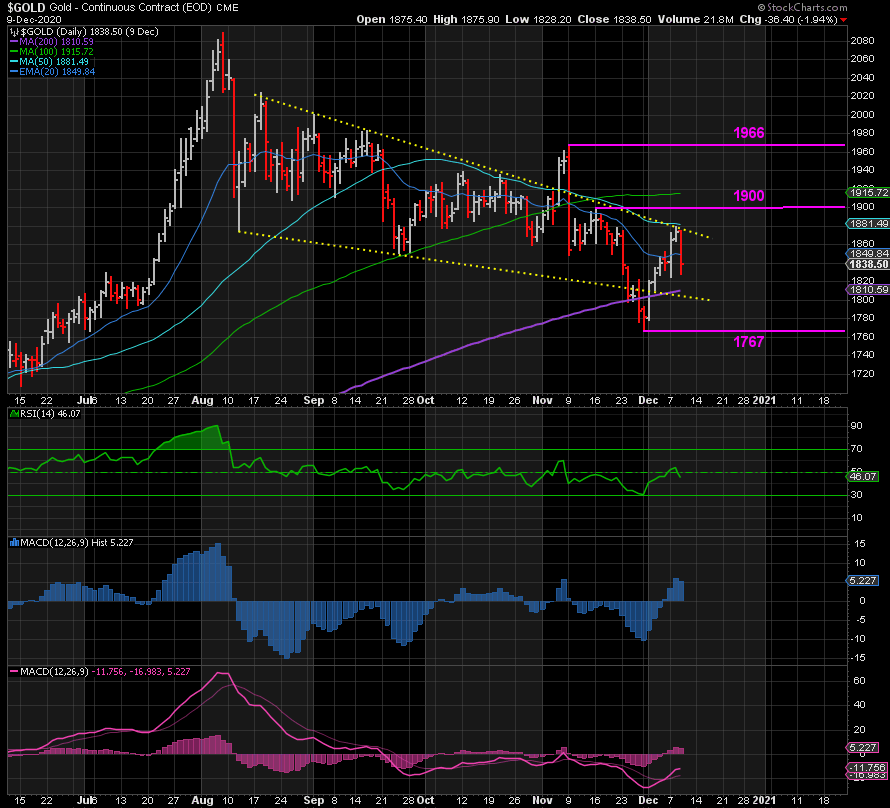
The daily chart shows the levels I am watching on the upside to increase the probability that the bottom is in place and we’re off to new highs, namely 1900 and 1966.
But note that the RSI and MACDs all allow for a positively divergent lower low should Gold decide to take another tumble before taking off.
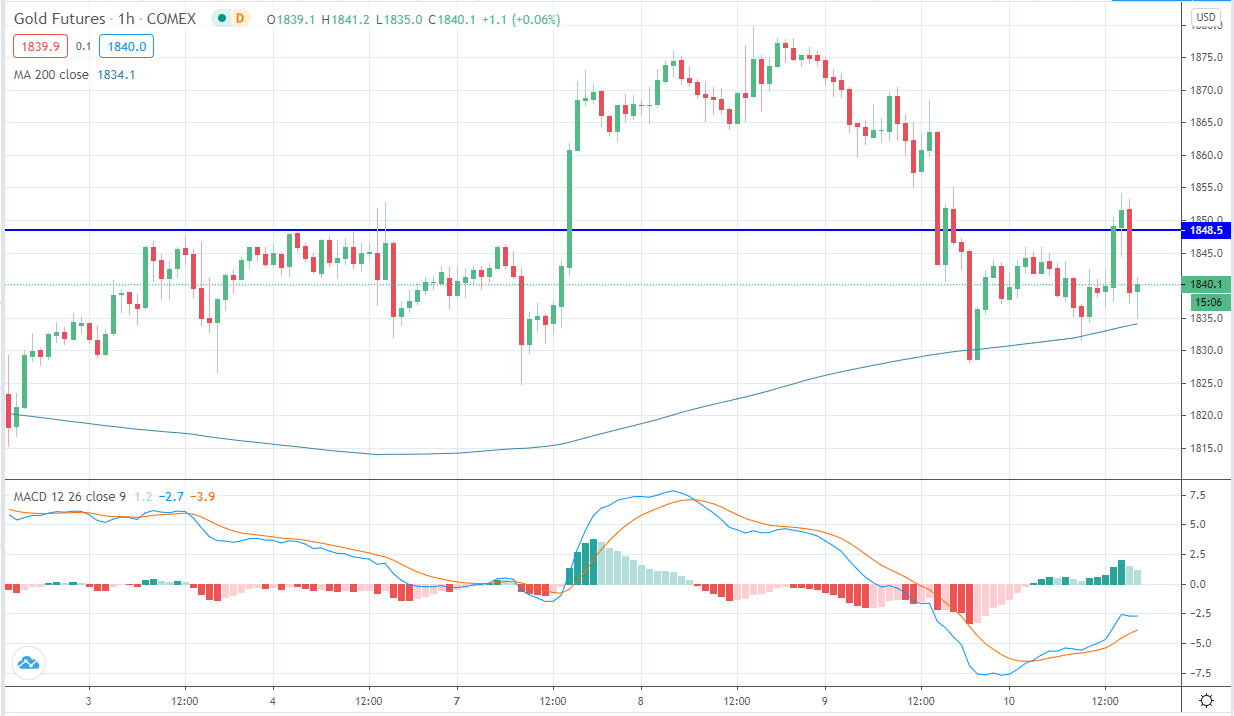
In the very short-term, looking at an hourly chart, there is a possible ABC correction under way from the recent peak of 1880, where:
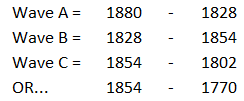
Note the two possibilities for the bottom of wave C: 1800, a nice round number and former support; and 1770, matching the low on November 30, setting up a potential double bottom.
So while we wait for the inevitable stimulus to drive prices north again, we are not out of the woods just yet. But the parameters are clear to signal the next move up to new highs in 2021.
Don’t miss a golden opportunity.
Now that you’ve gained a deeper understanding about gold, it’s time to browse our selection of gold bars, coins, or exclusive Sprott Gold wafers.

About Sprott Money
Specializing in the sale of bullion, bullion storage and precious metals registered investments, there’s a reason Sprott Money is called “The Most Trusted Name in Precious Metals”.
Since 2008, our customers have trusted us to provide guidance, education, and superior customer service as we help build their holdings in precious metals—no matter the size of the portfolio. Chairman, Eric Sprott, and President, Larisa Sprott, are proud to head up one of the most well-known and reputable precious metal firms in North America. Learn more about Sprott Money.
Learn More

You Might Also Like:

Looks like there are no comments yet.