


In thirteen years of monitoring the precious metals, I've seen countless interventions and manipulations in the gold market. Some are obvious and overt, but most are subtle and missed or overlooked by traders and investors. What you just saw on Sunday, December 3, was definitely not an intervention of the subtle variety.
Looking at other obvious manipulations designed to control or reverse sentiment and momentum in the gold market, several events come to mind. The most notorious was on September 6, 2011. Gold had been rallying all summer on safe-haven and sound money concerns, and early in the morning of September 6, the Swiss National Bank unveiled a plan to weaken the franc by pegging it to the euro. This was an extraordinarily bullish development for gold, and price was poised to surge to additional all-time highs above $1900. At that point, every gold short ever created was underwater. Uh-oh. Look at what happened next:

Price of Gold and Trump
As you can see, price fell about $120 in just over 24 hours. Sentiment and momentum were crushed, and just like that, the bullion banks were back in charge.
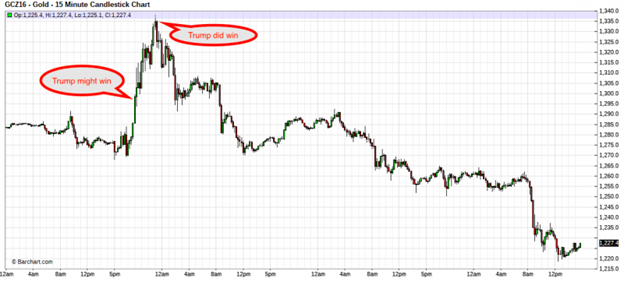
Another memorable event occurred when Donald Trump was elected U.S. president on November 8, 2016. You probably remember this one. The sudden shock of Trump winning sent the gold price sharply higher at first. However, once the London session began, price quickly fell backward and the total drop was again about $120, this time in a span of about 72 hours.
Gold Price at an All-time Daily & Weekly High
Again, there have been countless other events like these over the years, but let's get to the point of this post and offer an explanation of what you just saw a few days ago.
On Thursday, November 30, spot gold finished a month above $2000 for the first time in history. Then, on Friday, December 1, the gold price closed at an all-time daily and weekly high. Price finally breaking out of a three-year trading range was such an extremely bullish development that even the mainstream financial media was forced to take notice.

However—AND THIS IS VERY IMPORTANT—just like September 2011, new all-time highs meant that every single bullion bank short position ever created was now underwater. As such, I guess it should come as no surprise that price once again fell about $120 in less than 24 hours. Let's look a little closer at all of this so you can see how The Banks managed to pull it off.
First, be sure to note that the price spike Sunday evening did NOT occur at the GLOBEX re-open at 5:00 CST on the chart below. Instead, the gold price was flat for the first 15 minutes or so. The spike began at 5:15 CDT, and the entire $50 rally unfolded in about 12 minutes.

Next, note the volume bars at the onset of the rally and the two hours after. Three thousand contracts every two minutes may seem like a lot, but that's seen all the time during regular COMEX trading hours during the day. And note how volume dried up as price was slowly chewed away over the next few hours. Not even the "Asia open" at 7:00 pm CST could turn price and volume back higher.
So what happened here? To me, it's obvious.
After having all weekend to strategize, the bullion bank trading desks stood down and removed their ever-present offers for a few minutes Sunday evening. Some might have even put themselves briefly on the bid. Price shot higher and caught a few air pockets where, since price was in uncharted territory of new all-time highs, there were no offers at all. Less than 15 minutes later and not yet even an hour into the new week, price was up nearly $60.
And then The Banks went to work. They turned on their machines and got on the offer. Note the steady and relentless plunge back downward from 5:50 p.m. to 6:50 p.m. as the entire event was erased. OK, no harm, no foul, right? Price was still up a few dollars on the evening, and maybe this was all just another "fat finger" event? Nope.
The Banks then got busy in London, and as you can see, price was soon back below $2100. But they weren't done. Word was out that gold had seen a "blowoff top" overnight. Though price was only down $5 from Friday's close, once COMEX trading began, the selling of futures contracts accelerated, enhanced by a small rally in the dollar index that magically seems to appear every Monday at 8:30 eastern time. By late Monday, the entire event looked like this:

And here's a little more...let's say "circumstantial"...evidence that the price smash of Monday was planned and coordinated as early as late Friday. See this note from Bob Coleman via X:

Why on earth would there suddenly be a 4X surge in daily short volume on the GLD just as price was making new all-time highs? That only makes sense in either or both of these scenarios:
1. *Someone* knew that Monday would bring a price smash and wanted to profit.
2. *Someone* shorted GLD shares in order to grab some gold from the GLD warehouses in London—gold which would be dumped during LBMA hours on Monday.
Hopefully, by now, this is all clear to you. What we saw Sunday-Monday was a deliberate event, and it will be seen again. Whenever The Banks panic, you get overt manipulations, and we just got another one.
And why was this necessary? Again, as of Friday's close, EVERY SINGLE BANK SHORT EVER CREATED was down and underwater. That's an untenable situation. Price will rise again in the future, and it will make more new all-time highs. But The Banks have to be ready for this, and they can't be caught flatfooted as they were late last week.
Additionally, look at the impact the price raid has had on short-term sentiment and momentum. Late last week, prices were moving steadily higher and dips were being bought. Since the peak Sunday evening, prices are falling and rallies are being sold.

Finally, look at the candle that was deliberately painted on the daily chart below. This type of outside reversal and bearish engulfing candle will stick out like the proverbial sore thumb for days and will persist at least until a new higher high is made. By placing this candle on the chart for all to see, The Banks have effectively limited any upside price potential for the time being.

Bullion Price: Conclusions
In the end, however, the events of Sunday-Monday DO NOT mean that we're all doomed and that the gold price is now headed back to $1600 or some such nonsense. The global physical market remains strong, and monetary policy is shifting rapidly toward easing in 2024. Price will make new all-time highs again soon. It just won't be this week or next. The Banks worked overtime to regain some control. As such, we’re unlikely to wrest it back from them until sometime early next year.
Don’t miss a golden opportunity.
Now that you’ve gained a deeper understanding about gold, it’s time to browse our selection of gold bars, coins, or exclusive Sprott Gold wafers.

About Sprott Money
Specializing in the sale of bullion, bullion storage and precious metals registered investments, there’s a reason Sprott Money is called “The Most Trusted Name in Precious Metals”.
Since 2008, our customers have trusted us to provide guidance, education, and superior customer service as we help build their holdings in precious metals—no matter the size of the portfolio. Chairman, Eric Sprott, and President, Larisa Sprott, are proud to head up one of the most well-known and reputable precious metal firms in North America. Learn more about Sprott Money.
Learn More

You Might Also Like:

Looks like there are no comments yet.