


August 20, 2020
Today’s article will be relatively simple and straightforward. At the risk of repeating what I’ve said since June 6, the forecasted pullback is clearly well underway. The only question that matters now is where the lows will be before the spectacular rally to follow. Fortunately we may not need to be so precise, because the trigger for that rally is obvious, in my opinion: more currency printed out of thin air to fund more handouts from the government.
With the November elections fast approaching and political rhetoric heating up, it is only a matter of weeks before the Republicans and Democrats agree on new stimulus measures to replace the $600/week that most Americans lost this month. Neither side wants to be blamed for the lack of Doritos while watching Netflix 24/7 or by those who truly need the assistance. At the same time, although the Fed downplayed the need for more stimulus in their Minutes yesterday, make no mistake, they will be ramping up the printing presses again to facilitate their new average inflation target to be announced at the next FOMC meeting. This means targeting official inflation rates above 2%. I say “official” because we’re already seeing rampant inflation due to supply shocks in many sectors, most notably meat and more recently lumber. I only expect this to get worse in the months ahead just as the U.S. Treasury prepares to send out bombers to rain dollars from the skies, which the Fed has already financed and needs no approval from Congress. All of this means the rally in Gold and Silver is just getting started. Miners are getting ready to explode higher.
Ahead of that and what we’re seeing now, in my opinion, is a pullback to reset sentiment and squeeze out the weak longs that arrived late to the party before the even bigger celebration takes place soon. We’re also getting signals from other markets that the current correction is not done yet.
Stocks are finally starting to look soft…
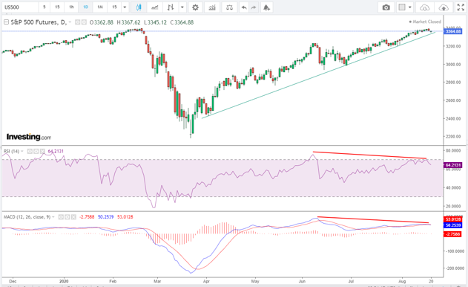

My primary target on the downside is 2900. Why do stocks matter to precious metals? Look at what happened to Gold and especially Silver in March, or just look at the current correlation coefficient.
Real yields have started to rise recently following a massive decline…
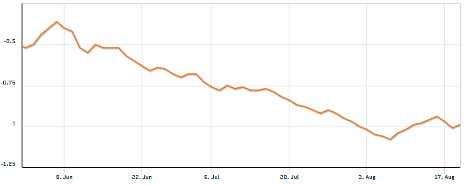
Courtesy of Quandl.com
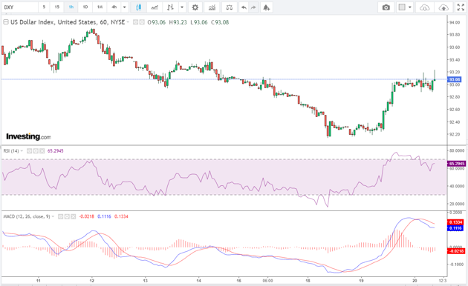
The dollar is finally seeing some signs of life after having been almost completely written off…
The levels to watch on the downside in metals and miners are as follows:
GOLD
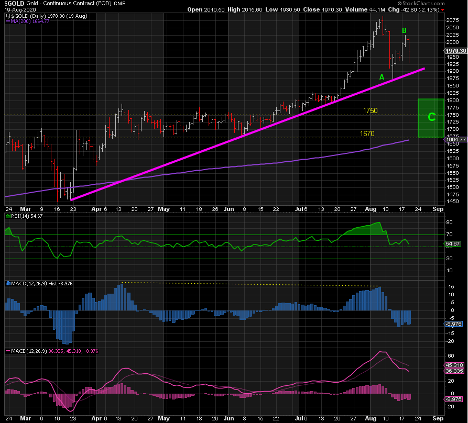
Gold hit a new record high in dollar terms at 2089 on August 7. By August 12, just three days later, it had fallen over 10% or $215, to trendline support at 1874. I call this wave A. It has since rebounded to a lower high of 2024 on Tuesday this week. I call this wave B. Assuming wave C is equal in size to wave A, i.e., a drop of another $215, this would put the target for the bottom in Gold at 1809, or around 1800. However, if wave C equates to 161.8% of wave A, i.e. $348, we may have to wait until key support at ~1670 before the low is in place. This happens to be the 200-day moving average too. There is also the key 1750 level in between. I plan to wait for the turn up from one of these support levels before adding to my long-term position.
The alternative scenarios are (1) we have already seen the low and we’re about to see a higher low above 1874 before heading up to new highs, or (2) we will continue treading sideways for a while before we head up to new highs. The third scenario is an extremely low probability: Gold breaks key support at 1670 and dumps. For that to happen, we would need a catastrophic crash in stocks. Again, I give that a less than 1% chance of occurring, but it is worth a mention. Nothing is certain.
SILVER
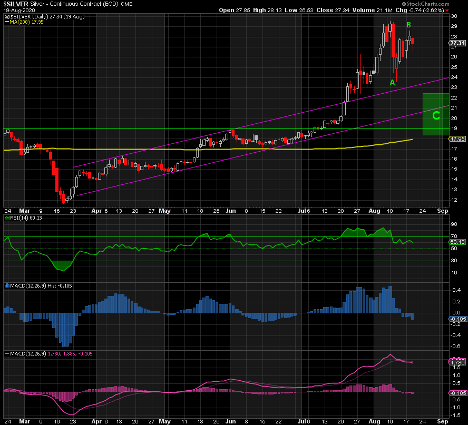
The scenarios for Silver and the miners are the same as those for Gold, but given their higher betas, expect bigger percentage moves. That said, the support levels for Silver are as follows:
· Upper trendline at ~23.50
· Wave C = A at 22.30
· Lower trendline at ~21
· Formerly key resistance and now support at 18.80-19
· Wave C = 1.618*A at 18.40
· 200-day moving average at 18 and rising. It may reach 18.40 before we bottom coinciding with the previous target
While this is a lot of levels to watch, we’ll likely get a better read on which will turn out to be the bottom based on what happens in Gold, where the RSI and MACDs are at, the bottom in stocks, the peak in DXY and real yields, and primarily the fundamental triggers outlined above. My preferred levels to watch are ~23, and if we see a sharp move below there, ~19. Again, I’ll be waiting for a bounce from one of these levels at the same time as the other signals play out to increase the likelihood that the bottom is in. Alternatively, you could just use these levels to average in for the rally to follow with a stop below 18.
GDX
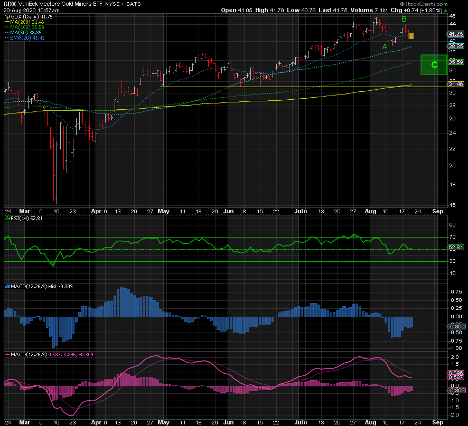
The support levels in GDX are as follows:
· Wave C = A at 37.20
· Wave C = 1.618*A at 33
· The 200-day moving average at 31.50 and rising
· The triple low at 31.30
SILJ
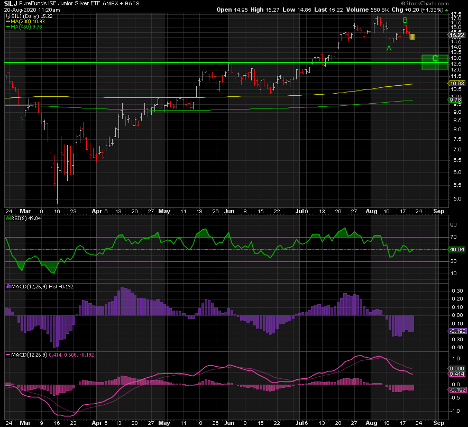
Support Levels:
· Wave C = A at 13.35
· July 14 low at 12.30
· Wave C = 1.618*A at 12
· Triple low and 70-week moving average at ~10.25
However low we get in the metals and miners, please keep in mind the pending monetary and fiscal stimulus on steroids about to be unleashed in September and the spectacular rallies that are sure to follow. This remains a buy-the-dip bull market, and as I said back in June…

Don’t miss a golden opportunity.
Now that you’ve gained a deeper understanding about gold, it’s time to browse our selection of gold bars, coins, or exclusive Sprott Gold wafers.

About Sprott Money
Specializing in the sale of bullion, bullion storage and precious metals registered investments, there’s a reason Sprott Money is called “The Most Trusted Name in Precious Metals”.
Since 2008, our customers have trusted us to provide guidance, education, and superior customer service as we help build their holdings in precious metals—no matter the size of the portfolio. Chairman, Eric Sprott, and President, Larisa Sprott, are proud to head up one of the most well-known and reputable precious metal firms in North America. Learn more about Sprott Money.
Learn More

You Might Also Like:

Looks like there are no comments yet.