


June 5, 2020
Gold bullion1 continued to deliver strong performance and was up 14.04% YTD through May 31, 2020, and 32.54% YOY. At the same time, gold mining equities (SGDM)2 have gained 18.26% YTD, and 61.70% YOY as of May 31. This compares to -4.97% YTD and 12.84% YOY returns for the S&P 500 TR Index.6 Silver posted substantial gains in May and is on the move again.
Month of May 2020
| Indicator | 5/31/2020 | 4/30/2020 | Change | % Chg | Analysis |
| Gold Bullion1 | $1,730 | $1,687 | $44.00 | 2.60% | Bullion consolidating gains |
| Silver Bullion | $17.87 | $14.97 | $2.90 | 19.34% | Silver beginning its price move |
| Gold Equities (SGDM)2 | $29.65 | $28.61 | $1.04 | 3.64% | Gold equities consolidating gains |
| Gold Equities (GDX)3 | $34.32 | $32.26 | $2.06 | 6.39% | same as above |
| DXY US Dollar Index4 | 98.30 | 99.02 | (0.72) | (0.73)% | Elevated but stable trading range |
| U.S. Treasury 10 YR Yield | 0.65% | 0.64% | 0.01% | 2.08% | Yields low and steady as QE takes hold |
| German Bund 10 YR Yield | (0.45)% | (0.59)% | 0.14% | 23.72% | Long-term negative yield trend |
| U.S. Treasury 10 YR Real Yield | (0.51)% | (0.44)% | (0.08)% | (17.39)% | Negative real yields stabilizing lower |
| Total Negative Debt ($Trillion) | $12.66 | $12.03 | $0.63 | 5.23% | Heading higher over the long term |
| CFTC Gold Non-Comm Net Position5 and ETFs (Millions of Oz) | 125.52 | 124.27 | 1.25 | 1.01% | Strong buying in Gold ETFs continuing |
Gold Bullion Continues to Climb
After a rather tumultuous past few months, every asset class appears to be normalizing, including gold bullion. Gold posted steady gains in May with a 2.6% increase. Since the March lows, gold is settling into a stable, rising channel posting higher highs and higher lows. Steady, robust buying in gold ETFs (exchange traded funds) and macro drivers confirm the gold accumulation pattern. The $1,800 price level remains the near term significant overhead resistance level. We would expect some modest consolidation at that level, barring any unexpected development.
Although the pandemic-related enormous monetary and fiscal packages have produced a remarkable recovery in the markets, the real economy remains in a fragile recovery state and vulnerable to any negative shock. In the past several weeks, capital markets and the economy have bifurcated. A global pandemic has never hit the global economy before, and as such, it is exogenous to the financial system where monetary and fiscal policies operate.
There are still questions as to how effective policy responses will be for this type of unprecedented economic crisis. For capital markets, two months ago was like "Armageddon" and now we've swung back to FOMO (fear of missing out). For the economy, it is still at risk of a second wave of COVID-19 infection and to profound structural changes in consumer behavior that may become permanent. Gold's strength continues to reflect that more monetary and fiscal stimulus is likely in the months ahead.
Figure 1. Gold Bullion Remains in its Rising Channel

Source: Bloomberg. Data as of 5/31/2020.
Silver Bullion is Coming to Life
Silver bullion has not experienced the same benefit as gold in terms of capital flows from large investment funds. By size and liquidity, the gold market is roughly 15 times larger than the silver market. Silver's performance lag is not unusual; historically, a substantial silver move typically trails an initial major gold move. Silver tends to play catch up after the macro fundamentals are established and gold has advanced, and we are starting to see this now. During the March downturn, silver sold off aggressively and has only recently begun to recover. Though silver has a significant industrial-use component, it still has a monetary value component at its core. In Figure 2, we compare the price performance of gold and silver since 2010. The chart pattern equivalent of the big base breakout of $1,350-$1,375 for gold is approximately $21-$22 for silver. Through this critical level, $21-$22 will open the $26-$27 price level on silver, which is roughly equivalent to the $1,600 price level for gold. At this writing, silver is at ~$18. We see $19 as the minor short-term resistance before silver reaches the significant $21-$22 resistance level. We view a test of the $21-$22 price level as highly likely. A successful break out would mean an incredible silver catch-up trade to gold.
For perspective, the current gold/silver ratio is at 97, compared to an average of 68 since 1988. Going back 50 years, 97 sits at the 99.4% tile reading, an extreme measure prone to mean reversion.
Figure 2. Silver Price versus Gold Price Movements (2010-2020)

Source: Bloomberg. Data as of 5/31/2020.
Gold Equities Continue to Advance
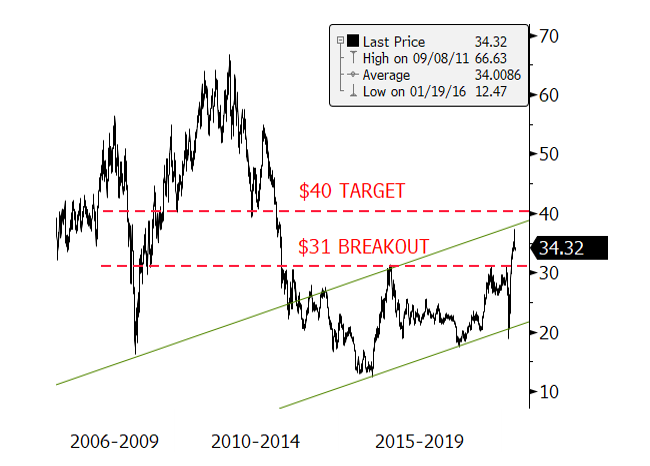
Gold equities having been advancing quickly after breaking out past the multi-year resistance of $31 on GDX,2 as we had predicted. Market breadth widened as the buying spread across almost all gold equities. Buying surged up to the first minor resistance level of $37-$38 on GDX, the upper channel (green lines in Figure 3). We expect the $40 target to be reached in short order, which will likely be followed by some consolidation.
We still see gold miners' earnings steadily being revised higher and consensus commodity forecasts continue to trend below market levels, laying the ground for future positive earnings surprises and strong positive earnings revisions. In Q1 this year, the average price of gold bullion was $1,583. Thus far in Q2, the gold price is averaging $1,702, an increase of $118 from Q1. The ability of gold equities to break through a multi-year resistance barrier on strong money flow dynamics sets the stage for higher targets. The entire trade range from 2013 to early 2020 was an incredibly large base pattern that projects to a GDX price of $50 as the long-term target.
Figure 3. Gold Equities Advancing to First Major Target
Source: Bloomberg. Data as of 5/31/2020.
Market Beginning to Price in Negative U.S. Interest Rates
In May, the Federal Reserve's ("Fed") Futures market began to price in the potential of negative Fed Funds rate in the December 2020 and out contracts. U.S. policymakers have pushed back against a negative interest rate policy ("NIRP") but have not ruled it out explicitly. There are significant roadblocks for NIRP, including political and legal, crippling the banking sector and disrupting the repo market (repurchase agreements are a critical part of the financial plumbing system). On a practical level, there is no significant evidence that NIRP even works.
The Fed view is that additional QE (quantitative easing) and yield curve control will likely produce the same desired results across broader financial conditions without the negative consequences of NIRP. While the Fed has pushed back against a NIRP, it has not ruled it out, perhaps to maintain downward pressure on interest rates. The result for countries with negative interest rates that did try NIRP were modest: a mild yield curve bull steepener (lower short rates relative to the long end) and marginally lower-term premiums. The potential damage to the banking system, the repo markets and savers hardly seem to justify negative rates.
The real risk, though, is that the market begins to price in NIRP and it heads towards a self-fulfilling prophecy as policymakers worry about not delivering on the market expectation. The risk becomes that the Fed either folds or the market craters. That was a key theme in 2019 when the Fed eventually cut interest rates in the face of market pressures (the 2019 Powell Pivot). If the market manages to corner the Fed into NIRP, gold bullion would likely explode to the upside, possibly through the 2011 highs of $1,921.
Figure 4. Fed Funds Futures Starting to Price in the Possibility of Negative Interest Rates
Source: Bloomberg. Data as of 5/31/2020.
If the pressure builds for NIRP and it is developing (see Figure 4 surge in open interest), the Fed will likely implement yield curve control sooner, rather than later. The central differential between QE and yield curve control is that QE targets the quantity, not the price of the target asset. Yield curve control targets the price outcome. Ultimately, it is the market's perception of the Fed's resolve that determines the quantity necessary to achieve yield curve control — it can be large or small. Yield curve control is almost certainly coming; it is only a question of when. Despite the astounding scope of QE Infinity, the amount is still not enough if the goal is to lift the U.S. unemployment level from the current depressionary levels of 20%-25%.
The Fed will likely target only the short end of the curve within a range of perhaps 20 basis points or so. With the front end of the curve permanently anchored, the curve can only experience a bear steepener (long yields rise) or a bull flattener (long yields fall). QE will compress the term premium pushing real rates lower with the front end fixed, leaving the long end as the only part of the curve that can provide discounting and signaling capabilities. If so, then everything in time will become increasingly correlated with breakeven yields. If QE and yield curve control "works" and demand rises, then breakevens will widen and push real rates lower (more negative, good for gold). Lower real rates stimulate more consumption and raise prices resulting in a bear steepener or "risk-on" market. In the post-COVID world, by this measure, gold will likely become positively correlated to "risk-on" reflation conditions. This change in gold's correlation to risk-on markets may run counter to the experience of the past decade, but the world has changed so much.
Tomorrow's Corporate Credit Crises
As impressive as the liquidity-driven equity market rally from the March lows has been, the corporate debt market may even be more impressive. Year-to-date 2020, corporate debt issuance has now exceeded $1 trillion, more than all of 2019, with no signs of slowing in the midst of one of the worst economic backdrops ever. The Fed promise of QE purchases of Treasuries, investment-grade debt and even junk bonds in unlimited quantities have kept yields low and have narrowed spreads. Despite that promise, rating agencies, credit analysts, and also the Fed continue to warn of the coming widespread downgrades, defaults and bankruptcies (Figure 4).
The Fed has stated that it expects the economic damage from the pandemic to be long-lasting and profound. The Fed also warns that as highly leveraged companies fail, it will amplify the economic downturn as companies lay off workers and cut investments. The U.S. is a consumer-driven economy, with 40 million recently unemployed from a total labor force of about 160 million. The backdrop could hardly be worse.
Surviving the Liquidity Crunch
Despite all the apparent risks and warnings, the market is quickly absorbing the corporate debt issuance at a panic buying pace. The alternative is zero or near-zero yielding government bonds. The Fed implementation of yield curve control will keep yields low and encourage more debt issuance. Like the previous decade, high debt levels continue to expand, and then some.
Pre-COVID, much of the proceeds of debt issuance were used to buy back shares. Post-COVID, the debt proceeds will be used to survive the liquidity crunch. Companies that had weak balance sheets and negative market trends are increasing debt to gain liquidity to survive the pandemic crisis, but will be at risk of being a credit event later. Whether the result is the Fed unleashing a new level of moral hazard and creating an army of zombie companies, or that the Fed has already averted a major systemic credit event, the game is not over yet.
Figure 5. Bloomberg Bankruptcy Index

Source: Bloomberg. Data as of 5/31/2020.
U.S.-China Tensions Rising, Yuan Weakening
U.S. and China relations have been a deteriorating spiral recently. Tensions have been rising for the past few years and are now escalating. At first, tension arose over the imbalance of trade. The next area of contention centered around technology. Now, the restriction of capital flows is being implemented. With world trade declining and capital restriction rising during a depression between the world's two largest economies, risk levels can soar quickly.
The best way to view this risk is probably via USD/CNY (official Yuan cross) or USD/CNH (offshore Yuan cross). USD/CNY is still a global bellwether for growth and risk appetite. A weaker Chinese Yuan Renminbi (CNY) would be a risk-off indication. A weak CNY would have a multitude of effects depending on the magnitude: a stronger U.S. dollar (USD) leading to rising USD funding stress, rising deflation via slowing growth, increasing emerging market stress and the subsequent bleed off into the financial system. Despite all the monetary easing, fiscal stimulus, dollar swap lines and expanded credit facilities, a USD funding shortage remains and is highly vulnerable to any liquidity shock event. A revisit of the mid-March liquidity crunch could be a possibility. A more significant risk scenario will be if the CNY is devalued at the same time bankruptcies are occurring. A weakened and fragile financial system facing a liquidity squeeze, credit events and tightening credit would be another market nightmare.
Figure 6. USD/CNY Poised to Weaken Further

Source: Bloomberg. Data as of 5/31/2020.
The New Normal
Events of May only reaffirm our bullish outlook for gold and gold equities, and the rest of the precious metals complex, especially silver. There is a remarkable disconnect between Wall Street and Main Street. Markets have rallied sharply due to the unprecedented amount of liquidity injected, while most investment funds remained underweighted, and are now being forced back into the markets. The economic and financial damage will be long-lasting and will provide ongoing support for the current precious metals rally. However, if yield curve control is implemented, economic recovery will create a more negative real yield condition as nominal rates remain fixed while inflation expectations rise. We are approaching the possibility of an odd scenario where if the economy does poorly, gold does well. And if the economy recovers, gold does well.
Don’t miss a golden opportunity.
Now that you’ve gained a deeper understanding about gold, it’s time to browse our selection of gold bars, coins, or exclusive Sprott Gold wafers.


About Sprott Money
Specializing in the sale of bullion, bullion storage and precious metals registered investments, there’s a reason Sprott Money is called “The Most Trusted Name in Precious Metals”.
Since 2008, our customers have trusted us to provide guidance, education, and superior customer service as we help build their holdings in precious metals—no matter the size of the portfolio. Chairman, Eric Sprott, and President, Larisa Sprott, are proud to head up one of the most well-known and reputable precious metal firms in North America. Learn more about Sprott Money.
Learn More
You Might Also Like:

Looks like there are no comments yet.