


Did you know you can get the Sprott Money Monthly Wrap Ups, Ask The Expert,
special promotions and insightful blog posts sent right to your inbox?
Sign up to the Sprott Money Newsletter here.
The Fed raised rates by 0.75% yesterday to 1.50% and plans to continue raising rates to at least 2.5% in the next few months. Quantitative Tightening, or QT, is continuing at its announced pace also. While the Fed’s move was hawkish to say the least, this was all expected, and the markets sold the rumor but bought the fact.
The problem for the Fed now is that its credibility is virtually non-existent, courtesy of statements like “Subprime is contained”, “It’s not QE”, “Inflation is transitory”, and more recent comments like this:
“Overall economic activity appears to have picked up after edging down in the first quarter.”
This was the first line of the FOMC statement. Nothing could be further from the truth. Retail sales were abysmal in May, and the Atlanta Fed is already slashing Q2 growth forecasts. This is just the tip of the iceberg when it comes to the Fed’s comments on the economy, including a supposedly “tight labour market” despite soaring jobless claims and “robust demand” when consumers have spent their savings and maxed out their credit cards.
The Fed also gave itself a “Get Out of Jail” card by saying the usual line that their plans can change depending on incoming data.
Simply put: focus on the Fed’s actions, not what they say. Unless they plan to crash the economy and markets and cause a systemic collapse ahead of midterm elections this year, it’s still only a matter of time before they pull another 180 to QE infinity—September/October at the latest, imho.
Switching to precious metals and miners, many are wondering if we will ever reach bottom and head higher. When people lose faith like this, I like to briefly look back at similar episodes where investors threw in the towel and see what happened next.
GOLD – Weekly
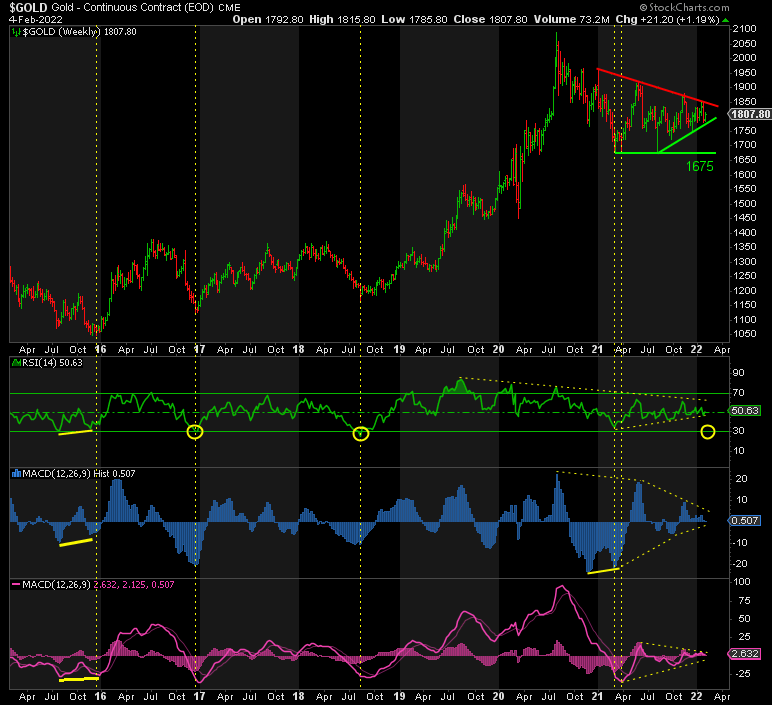
This chart shows all the major lows going from 2015 to 2021. They are as follows:
- 1045 in December 2015
- 1124 in December 2016
- 1167 in August 2018
- Triple low at 1675 in March and August 2021
In each of these cases, the following conditions were observed:
- They were all coming off steep declines.
- Technical indicators such as the RSI and the MACDs were extreme oversold and/or positively divergent.
- Sentiment was not in the toilet; it was in the sewer.
- COT data showed that the Bullion Banks had covered much of their short positions and the Funds had done the same thing on the long side.
With respect to fundamentals, which these days means Fed policy given that these markets are centrally managed, it’s more art than science, but we can observe some obvious signals here too.
In December 2015, the Fed had already ended QE and was embarking on a rate hike binge of 25 basis points almost every quarter over the next three years from zero to 2.5%. Gold rallied and dumped multiple times during this period, but even as rates rose, Gold was setting higher and higher lows in December 2016 and August 2018. In other words, the trend was up. Then it finally broke key resistance in the 1360s and 1370s in June 2019. This followed the dump in stocks in Q4 2018, the end of ‘QT’, and the beginning of a return to zero rates and QE courtesy of the Fed. Sound familiar? It’s what we’re waiting for today. The next Fed 180.
The repo crisis began in September 2019 with rates hitting 10% and ultimately led to the March 2020 meltdown in everything but the dollar, triggered by the Covid lockdowns. Gold went down with the ship too. But what happened next? The Fed printed $6 trillion to support the markets, and Gold soared to new record highs.
Emphasizing the influence of the Fed, it was in July 2020 when they cut QE by 88% to $120 billion a month, followed by the end of fiscal stimulus on August 1st. Gold and Silver peaked the next day, and we’ve been trading sideways to down ever since.
The point being that when the Fed pulls another 180, you can be extremely confident that Gold, Silver, and the miners are going ballistic. But for now, we must weather rate hikes and QT that will suffer the same fate as they did in 2018.
Real yields are another indicator of Gold’s prospects, and the 10-Year real yield has now turned positive for the first time since March 2020, reaching a high of 0.89% on Tuesday. It’s only a matter of time before they head south again, imho.
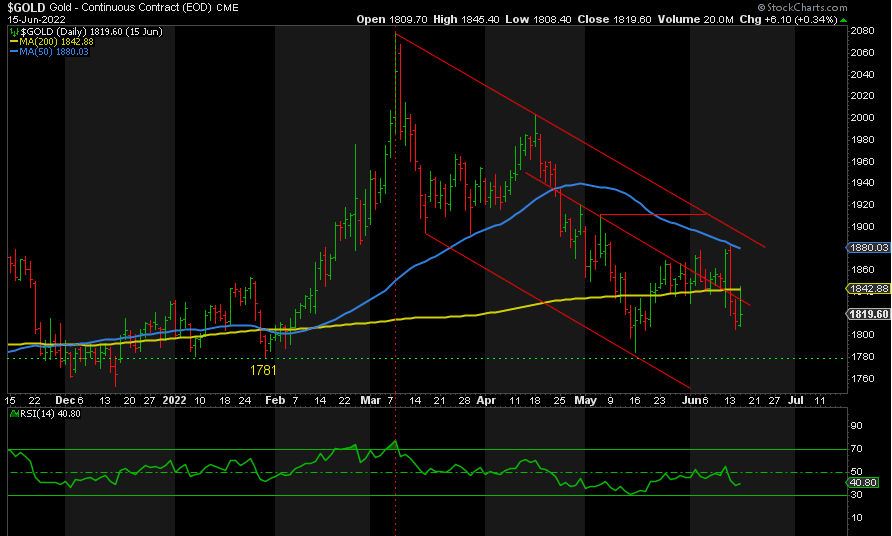
Today I believe the low is in at 1675, but I don’t rule out a lower low. COT data is bullish, extremely so in Silver, as the Bullion Banks have slashed their shorts. Sentiment is weak but could get worse. I’m looking for a break of 1911 and a series of higher lows and higher highs to signal the rally to new record highs. Any signs from the Fed that they’re about to pivot again will cement my view that the rally has begun.
In summary, the best times to buy precious metals and miners follow steep declines; they’re oversold; sentiment is bearish as everyone is throwing in the towel; the Bullion Banks are neutral to long; real yields are falling; and Fed policy is on the verge of an about-turn. All of these conditions are falling into place now. There’s a reason premiums on physical metals remain high: the smart money knows what’s coming. We’re far closer to the bottom than we are to the next peak.
Don’t miss a golden opportunity.
Now that you’ve gained a deeper understanding about gold, it’s time to browse our selection of gold bars, coins, or exclusive Sprott Gold wafers.


About Sprott Money
Specializing in the sale of bullion, bullion storage and precious metals registered investments, there’s a reason Sprott Money is called “The Most Trusted Name in Precious Metals”.
Since 2008, our customers have trusted us to provide guidance, education, and superior customer service as we help build their holdings in precious metals—no matter the size of the portfolio. Chairman, Eric Sprott, and President, Larisa Sprott, are proud to head up one of the most well-known and reputable precious metal firms in North America. Learn more about Sprott Money.
Learn More
You Might Also Like:

Looks like there are no comments yet.