


Did you know you can get the Sprott Money Monthly Wrap Ups, Ask The Expert,
special promotions and insightful blog posts sent right to your inbox?
Sign up to the Sprott Money Newsletter here.
While we wait for greater clarity on the big picture for precious metals and miners, the short-term scenarios are becoming rather clear.
GOLD
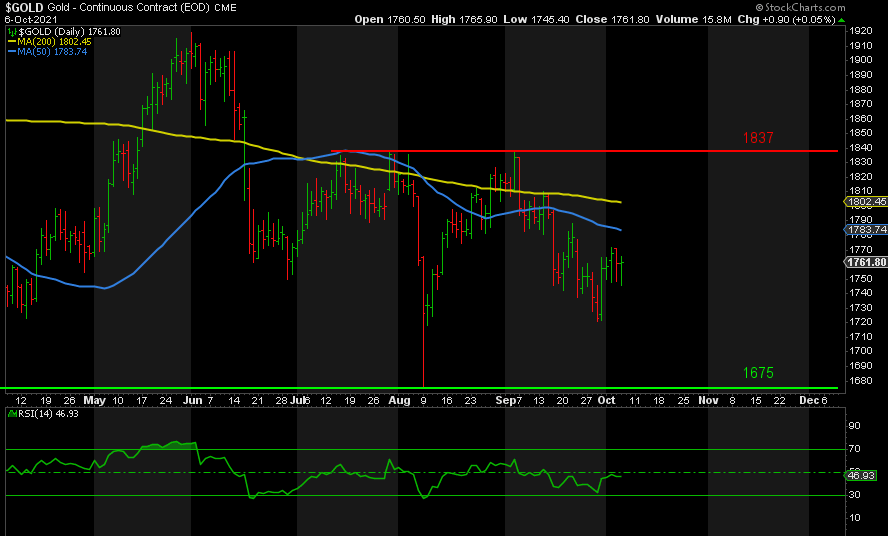
Following its fourth rejection at 1837, Gold fell to 1722 in a series of lower highs and lower lows. The latest rebound generated a great deal of optimism, but we have neither set a higher high nor broke any resistance of note. So far, Gold has been unable to get above 1770. But it’s in a bullish flag pattern, which suggests that if we do break up we’ll at least get a test of 1837. Above 1837 and 1920 would be the next target.
However, if this mini rally fails and decides to turn down, it’s becoming less likely that 1675 will hold. Personally, it would be ideal if we got a positively divergent lower low below 1675, setting up the next rally to 1920 or perhaps to new highs.
Worst-case, it just dumps to 1500 to complete the big ABC pattern down from 2089 in August last year.
“Okay David, that’s really helpful. It could go up or down.” I hear you, but it’s all about signposts. We take out 1770, then the 50-day moving average, followed by the 200-day, and that is encouraging for a test and break of 1837, but it needs to take that level out.
By contrast, if we drop under the prior low of 1721, a break down below 1675 is a high probability, so don’t try to catch a falling knife. Buy it on a break of resistance back above 1700.
If it falls to the 1500s, get ready to buy, imho.
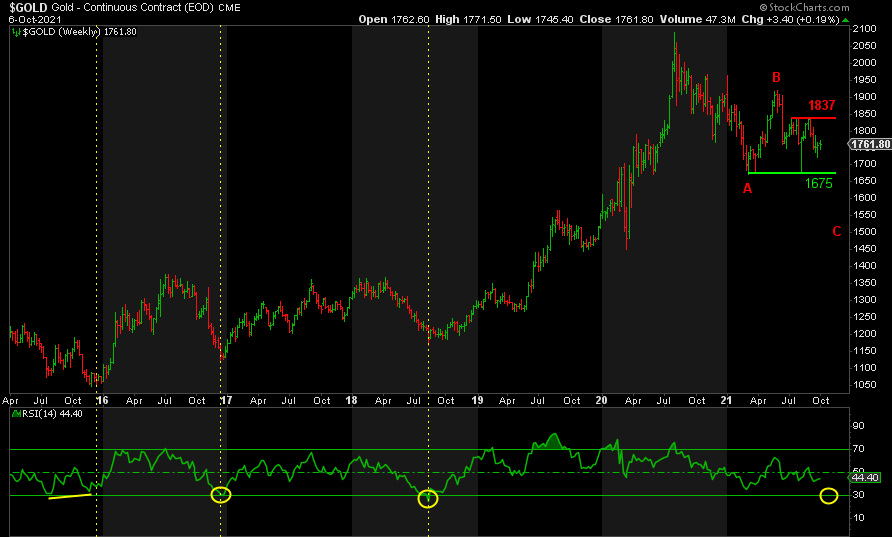
The weekly chart above shows the C target where it matches the size of wave A. At the risk of repeating myself, I would still prefer to see a weekly RSI of 30 or below to signal the final low is in place.
Commercials have slashed their short positions, and sentiment was awful ahead of this latest bounce. Both good signs for a sustainable low. However, the resurgence of hope on a $50 rebound does not give me confidence. It’s preferable that hope is truly crushed such that the weak hands don’t just jump back in the boat (i.e., get long again) after they just abandoned it a few days ago. You want them to lose all faith in any upside, so that before they realize the mega rally has taken off, they have already missed most of it.
GDX
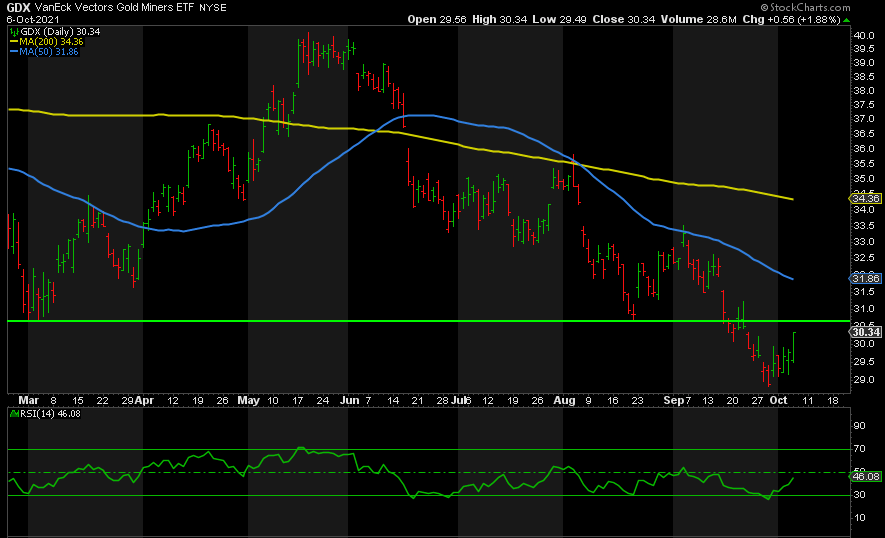
Gold miners have hardly been a beacon of light for the sector lately. It’s been one-way traffic with a few minor bumps along the way. Major support has been broken at 30. It’s no surprise then that sentiment is extremely bearish to the point where it matches that of the lows in August 2018. It has only been lower briefly in March 2020 and in late 2015 when “the low” finally arrived.
GDX, like Gold, finally caught a bounce off the low at 28.83 and is now trying to recapture its former support. I would need to see an imminent break of 30.50 followed by a break back above the 50-day and 200-day moving averages. If that happens, we could recapture the 2011 peak levels in the 60s. But seeing is believing while the trend is clearly down.
The RSI certainly has the set-up in place for a positively divergent lower low if it does head back down.
Simply put, no major resistance has been broken here either despite the positive price action. Until we do get above some key resistance, try to keep hope in check.
SILVER
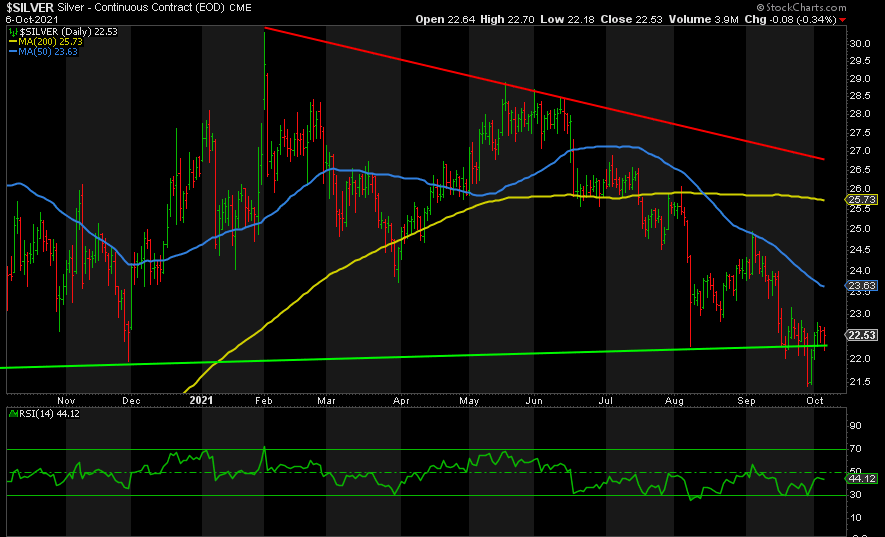
Silver, like GDX, broke its key support zone between 22-22.30. It managed to climb back above there, hope took off again, and now we’re back to that support. A huge bullish flag since the peak in May certainly supports a bottom soon. So does the positively divergent lower low at 21.41. This is like tossing a coin, but rather than try to call heads or tails in advance, improve your odds by waiting to see a higher high above 23.15. There will be plenty of upside thereafter. By contrast, if we fall below 21.41, then 18 is back on the table.
SILJ
Saving the ugly duckling until last…
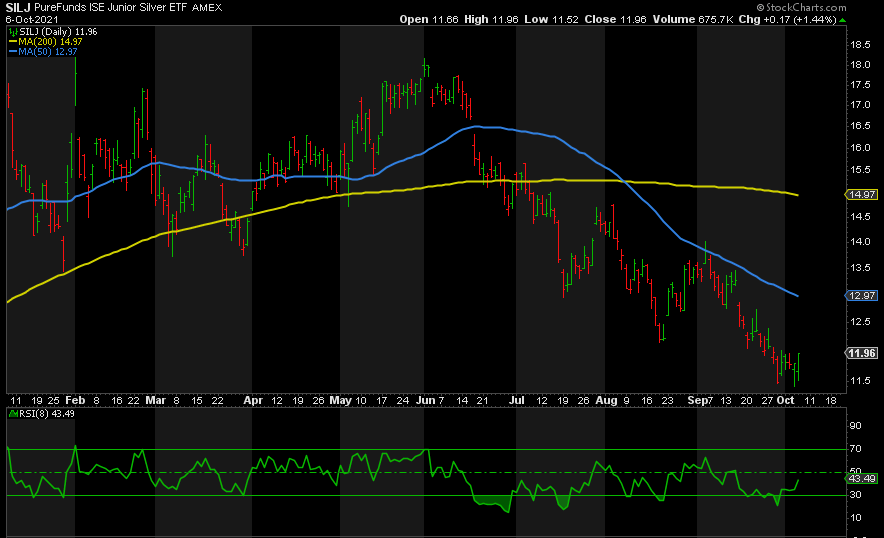
SILJ is just an awful chart. Almost cut in half inside four months with little sign of a resurgence yet. This despite being extreme oversold for much of the entire sell-off. My support levels on the downside are 8.00 and 6.77. A break of 14 followed by a higher low would indicate the pain is over. Watch the 50-day moving average ahead of that.
It’s not a question of if but when. As I shared last week, all the tools I use in my process—a process back-tested over many, many years—are pointing North. But as we saw during such drawn-out selloffs in 2015, 2016, and 2018, it can really test your patience before it finally decides to shoot higher.
Don’t miss a golden opportunity.
Now that you’ve gained a deeper understanding about gold, it’s time to browse our selection of gold bars, coins, or exclusive Sprott Gold wafers.


About Sprott Money
Specializing in the sale of bullion, bullion storage and precious metals registered investments, there’s a reason Sprott Money is called “The Most Trusted Name in Precious Metals”.
Since 2008, our customers have trusted us to provide guidance, education, and superior customer service as we help build their holdings in precious metals—no matter the size of the portfolio. Chairman, Eric Sprott, and President, Larisa Sprott, are proud to head up one of the most well-known and reputable precious metal firms in North America. Learn more about Sprott Money.
Learn More
You Might Also Like:

Looks like there are no comments yet.