Did you know you can get the Sprott Money Monthly Wrap Ups, Ask The Expert,
special promotions and insightful blog posts sent right to your inbox?
Sign up to the Sprott Money Newsletter here.
Little has changed in the precious metals over the past week, so I’m going to focus on the dollar as a key driver of Gold’s future direction.
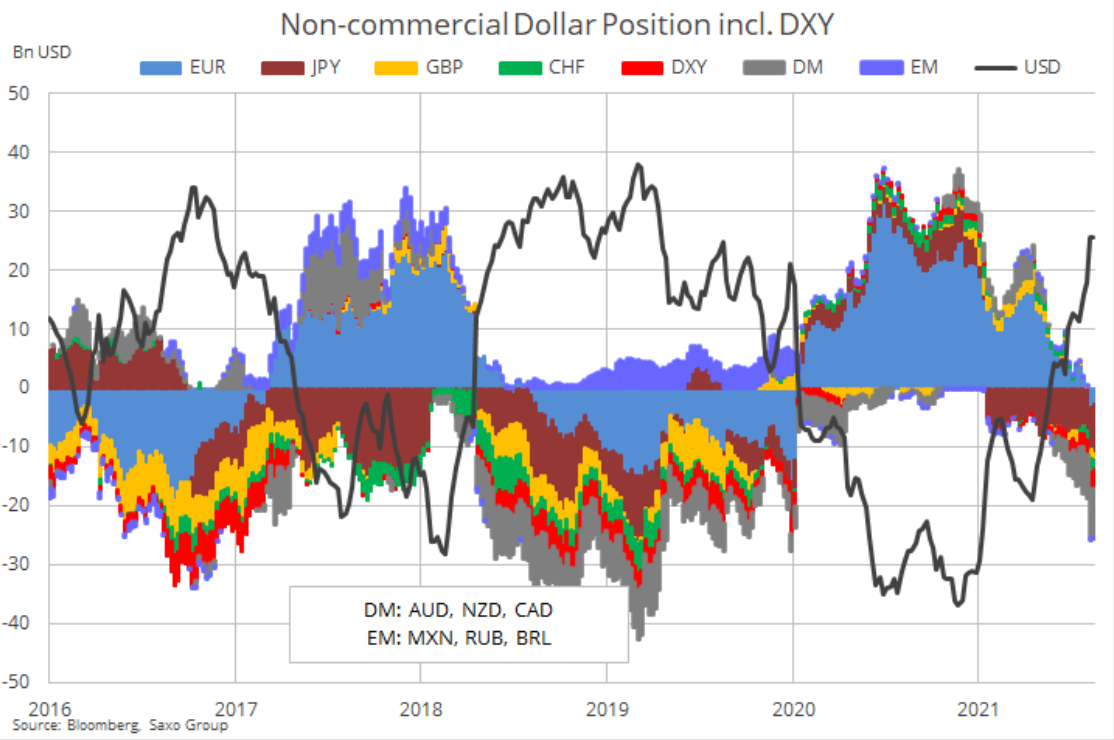
I have been pounding the table consistently for weeks now stating my belief that we have not seen the peak in the DXY and therefore the lows in the metals and miners. The fact that neither the Funds nor the Commercials cut their relative positions despite the sharp drop from 94.50 resistance indicates that they don’t believe the top is in either. There is still room for those respective positions to increase to 2019, 2018, or 2016 peak levels before they dump them in the opposite direction as the dollar dives.
Courtesy of Ole Hansen of Saxo Group, my first go-to chart I look at every Monday morning:
My target on the upside remains 96.50 for several reasons:
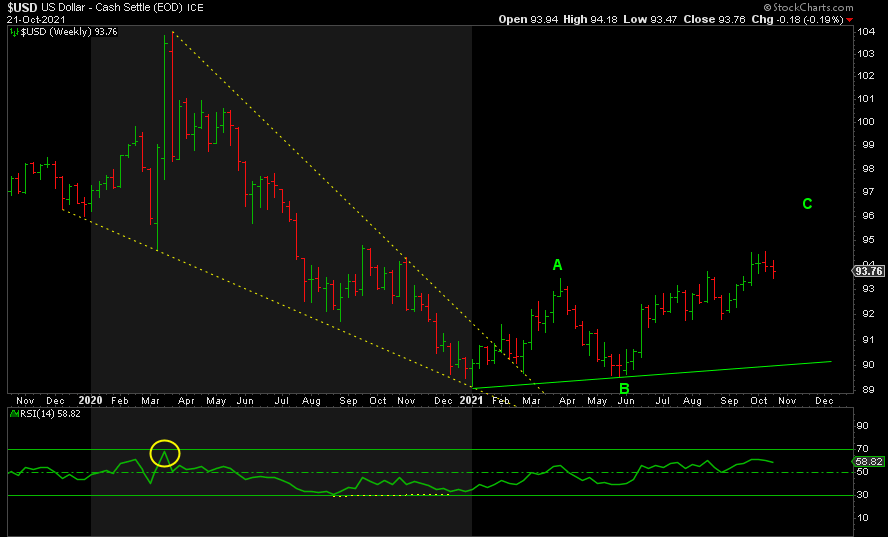
96.50 is the point where wave C is equal to 1.618 times wave A from 89.17 to its peak of 93.47, or a rise of $4.30. Wave C began where wave B bottomed out at 89.52. 4.30 times 1.618 is about $7. Add that to 89.52 and you get 96.50, approximately. This is a standard ABC corrective rally before it falls to a new lower low next.
96.50 also represents 50% retracement of the decline from the peak at 104 in March 2020 to the bottom at 89.17 in January this year.
When it peaked at 104, the weekly RSI hit an extreme overbought 70. It could certainly do that again and has the potential to do so should DXY rise to 96.50.
Lastly, the upper band of DXY’s channel, which provided the resistance at 94.50, certainly allows for such a move up in the near future before it capitulates.
Ahead of that rally, we have yet to confirm the bottom in the DXY. My target zone of support off the peak at 94.50 was and is 92.85 to 93.70. We have already taken out 93.70 and next is the 61.8% retracement at 93.50, which is where it bounced today, Thursday. Below there is the 76.4% Fibonacci level at around 93.30, which is where the 50-day moving average is. But my preferred target is 92.85.
Without getting into the details of it, 92.85 is where wave C of the current drop from 94.50 equals 1.618 times wave A.
It’s also the 61.8% retracement of the rally from the triple bottom at 91.78 to the 94.50 peak.
Now the gravy: it also happens to be where the support trendline of the channel is rising. A wonderful confluence of indicators.
This is just my best guess for the future direction of the DXY based on several pieces of data that are lining up together. I could be completely wrong. But if this is anywhere close, and the inverse relationship with Gold in particular holds, then Gold could rise to 1837 again or 1880 while the DXY falls to 92.85. But once DXY hits its low and turns up to a higher high, say 96.50, then Gold could fall below 1675, and the rest of the complex with it.
Now going one step further… I believe that the DXY will rise into a peak, probably around 96.50, from which it will fall to a lower low below 89.17. That’s what happens after an ABC corrective move up—it’s followed by five waves down. The positioning data provided by Ole and his team at Saxo certainly supports that thesis. It could take another couple of months or more before we reach that peak, but if and when that drop begins, watch Gold, Silver, and the miners finally soar to new heights.
Don’t miss a golden opportunity.
Now that you’ve gained a deeper understanding about gold, it’s time to browse our selection of gold bars, coins, or exclusive Sprott Gold wafers.
About Sprott Money
Specializing in the sale of bullion, bullion storage and precious metals registered investments, there’s a reason Sprott Money is called “The Most Trusted Name in Precious Metals”.
Since 2008, our customers have trusted us to provide guidance, education, and superior customer service as we help build their holdings in precious metals—no matter the size of the portfolio. Chairman, Eric Sprott, and President, Larisa Sprott, are proud to head up one of the most well-known and reputable precious metal firms in North America. Learn more about Sprott Money.
Learn More
You Might Also Like:


Looks like there are no comments yet.