


Did you know you can get the Sprott Money Weekly Wrap Ups, Ask The Expert,
special promotions and insightful blog posts sent right to your inbox?
Sign up to the Sprott Money Newsletter here.
Gold, Silver, and the miners have taken a hammering since the peak in Gold at 2003 on April 18. Many blame the Bullion Banks, and they are certainly a factor here, but there were warnings from several traditional indicators that this dump could occur.
First, let’s go back to the peak of 2079 on March 8. This is the weekly chart for Gold:
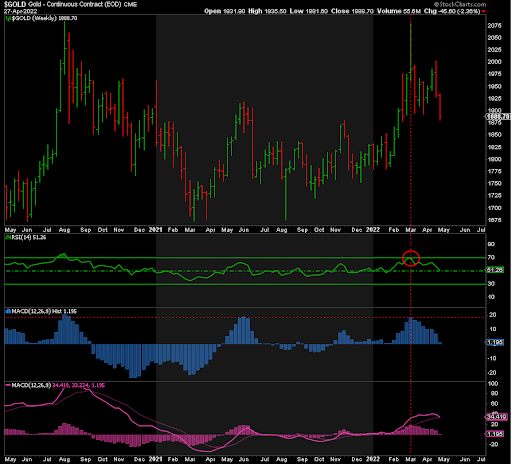
There were several signals that a peak was probable:
-
Prior record high at 2089 was acting as resistance
-
Weekly RSI hit extreme overbought RSI of 70
-
MACD Histogram matches multiple prior peak levels
-
MACD Line is negatively divergent, significantly lagging its level at the prior record high
Since that peak, these indicators have just been trending lower and lower, despite the pop in price to 2003 on April 18. This in and of itself suggested we had lower to go, and we have seen how that has played out.
Now the weekly MACD Line is testing its signal and the MACD Histogram is on the verge of falling below zero. This may provide a short-term bounce, but until price suggests otherwise, the trend remains down for now.
So what triggered the peak on April 18? Perhaps Fibonacci can tell us. Below is the daily chart for Gold:
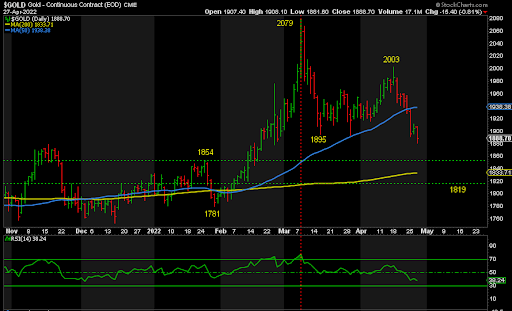
1895, the low on March 16, was the 61.8% retracement of the entire move up from 1781 in January to the peak of 2079.
Interestingly, for the peak of the ensuing bounce to 2003…
- 2009 was the 23.6% Fib of the entire 1781-2079 rally
- 2009 was also the 61.8% retracement of the 2079-1895 drop
So why did it stop at 2003? Well, that’s only $6 away from 2009, and 2000 is a nice round number for resistance.
How low does Fibonacci suggest we could go? If this is a standard A-B-C correction, where wave C is the same size as wave A, then ~1820 would be the primary target:
- Wave A: 2079 – 1895
- Wave B: 1895 – 2003
- Wave C: 2003 – 1819
Looking to invest in physical gold? Check out our collection here.
The peak on January 25 at 1854, ahead of the low of 1781, could also act as support. Then there is the 200-day moving average now at 1834 and rising. 1819 would make sense if the market takes out the stops below the 200MA before moving higher again.
However, if Gold falls below 1781, then it could reach 1700 or lower before turning up again. But let’s cross that bridge if and when we come to it. My primary target on the downside is around 1820.
Other signals that suggested a peak was coming were sentiment and COT positioning. Sentiment was extremely bullish at 2003, which is typically a great contrarian indicator, especially in precious metals. While that bullish sentiment has receded somewhat, we’re nowhere near capitulation levels. We don’t need to go that low, but it’s possible. It certainly allows for further downside.
Now for COT positioning and the Bullion Banks. This chart says it all:
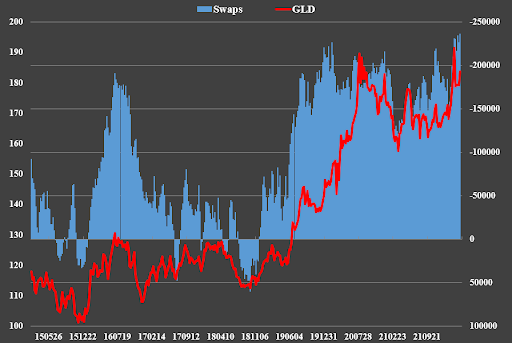
The “Swaps” or Bullion Banks were recorded short at the peak of 2003 on April 18, even more so than at 2079 on March 8. The rest, as they say, is history. Only now, as the price is falling, are they covering their shorts. But they have a long way to go before getting anywhere near zero.
Last but not least, real yields were clearly a warning.
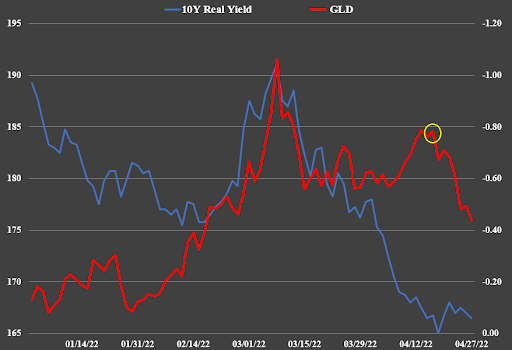
Gold and real yields have a near-perfect inverse correlation over the long term. When real yields rise, Gold typically falls, and vice versa. While the relationship often breaks down in the short term, ultimately it reconnects. Gold did not fall as real yields bottomed out in March and soared to their highest level since March 2020. Either real yields had to fall again or Gold did. It’s now clear that Gold would take the fall and still has further to reconnect with real yields.
In conclusion, Gold may be overdue a bounce here, but the balance of data suggests it has lower to go yet. My primary target is 1820, but I will wait for it to stop falling and break resistance to ensure that the bottom is in. In my opinion, this is all being driven by the Fed’s tightening policies, and it is when they have to pull another 180 to stimulus on steroids—or before—that Gold, Silver, and the miners take off to new highs. It’ll be worth the wait!
Don’t miss a golden opportunity.
Now that you’ve gained a deeper understanding about gold, it’s time to browse our selection of gold bars, coins, or exclusive Sprott Gold wafers.


About Sprott Money
Specializing in the sale of bullion, bullion storage and precious metals registered investments, there’s a reason Sprott Money is called “The Most Trusted Name in Precious Metals”.
Since 2008, our customers have trusted us to provide guidance, education, and superior customer service as we help build their holdings in precious metals—no matter the size of the portfolio. Chairman, Eric Sprott, and President, Larisa Sprott, are proud to head up one of the most well-known and reputable precious metal firms in North America. Learn more about Sprott Money.
Learn More
You Might Also Like:

Looks like there are no comments yet.