


November was a tough month for gold bullion, with the yellow metal1 losing 5.42%. Year-to-date through November 30, 2020, gold has gained and 17.11% and is up 21.38% YOY.1Silver bullion2 lost 4.28% in November, but has risen 26.84% YTD and is up 32.99% YOY. Gold mining equities pulled back in November (-7.59%) but have gained 17.88% YTD and 26.85% YOY as of November 30 (as measured by SGDM3). This compares to 14.02% YTD and 17.46% YOY returns for the S&P 500 TR Index.6
Month of November 2020
| Indicator | 11/30/2020 | 10/31/2020 | Change | Mo % Chg | YTD % Chg | Analysis |
| Gold Bullion1 | $1,776.95 | $1,878.81 | ($101.86) | (5.42)% | 17.11% | Correction back to rising 200 dma* |
| Silver Bullion2 | $22.64 | $23.66 | $1.01 | (4.28)% | 26.84% | Rangebound $21 to $26 since September |
| Gold Equities (SGDM)3 | $29.76 | $32.04 | ($2.28) | (7.13)% | 18.33% | Sharp pullback <200 dma and support |
| Gold Equities (GDX)4 | $34.68 | $37.49 | ($2.81) | (7.50)% | 18.44% | Same as above |
| DXY US Dollar Index5 | 91.87 | 94.04 | (2.17) | (2.31)% | (4.69)% | New 52-week low |
| S&P 500 Index6 | 3,621.63 | 3,269.96 | 351.7 | 10.75% | 12.10% | New all-time highs |
| U.S. Treasury Index | $2,565.34 | $2,556.44 | 8.9% | 0.35% | 8.25% | Range trade since March 2020 |
| U.S. Treasury 10 YR Yield | 0.84% | 0.87% | (0.03)% | (3.98)% | (1.08)% | Yields below early November highs |
| U.S. Treasury 10 YR RealYield | (0.96)% | (0.84)% | 0.13% | (15.28)% | (1.09)% | Rolling down, breaking short-term uptrend |
| Silver ETFs (Total Known Holdings ETSITITL Index Bloomberg) | 871.46 | 885.52 | (14.06) | (1.59)% | 43.60% | Rangebound since August |
| Gold ETFs (Total Known Holdings ETFGTOTL Index Bloomberg) | 107.67 | 110.84 | (3.17) | (2.86)% | 29.85% | Selling mainly via GLD (SPDR Gold Shares) |
* dma = displaced moving average
Gold Dips Below $1,800 in November
Gold fell $102/oz (-5.42%) in November to close at $1,777, dipping below the $1,800 level and the 200-day moving average. Although there were not any significant deterioration in gold fundamentals last month, there was an unusual and dramatic shift in market expectations and positioning that impacted gold negatively.
By late summer, the broader market was positioned not only for a chaotic U.S. presidential election outcome but for the post-chaos to extend into Inauguration Day in January 2021. Due to the idiosyncratic nature of hedging a large number of possible chaotic election outcome scenarios and market makers reducing exposures into yearend, protection was concentrated as longer-dated (November to January) volatility. The large size and expensive nature of these hedges can be best described as "crash hedges." Overall, fund positioning levels were also reduced, and a static activity level took hold, further decreasing the prevailing low market liquidity and worsening an already poor market depth situation. The market had positioned itself mainly for a chaotic U.S. election outcome with some dabbling on the edges for a Democratic sweep near the election date.
The actual results of the recent U.S. presidential election completely negated the crash scenario. Instead, it gave the market its ideal outcome: a clear presidential winner, no violence or any domestic crises, and a split government. Though there remain run-off elections for two Senate seats in Georgia, it is anticipated that the Republicans (GOP) will retain the two Senate seats and majority control of the Senate. A split government is viewed favorably by the market, and history confirms this view as well. The market now considers a GOP-controlled Senate as a firewall blocking any meaningful tax increase, a reversal of the Trump tax cuts and excessive regulation. The chances of massive fiscal spending will become unlikely (meaning a smaller deficit), but the hope of a scaled-back infrastructure plan and a compromise fiscal stimulus bill will provide some support.
Though the split government result was a welcomed outcome for the market, the stock market's real fuel was unwinding the "crash hedges." The large number of crash protection hedges were unwound into a steep decay. The effect was essentially a short squeeze, forced buying into higher market prices.
Caught in the Wake of a Factor Quake
If the unwinding of the "crash hedges" was the fuel for a general market lift, then the Pfizer vaccine news was the booster rocket that ignited the reflation rotation trade. Pfizer's vaccine news was well beyond the best-case scenario. With a 90% efficacy rate (optimistic range was 60% to 70%), vaccinations would only need to have about 60% coverage to achieve herd immunity, implying a much faster and more comprehensive recovery from COVID is now possible.
For the past five years, the market had been crowding more and more into the long duration trade (low growth, low yield, secular growth trade) until reaching extremes, such as having only five stocks comprise 24% of the weight of the S&P 500 Index, and growth versus value going parabolic. Pre-election, the market setup was extreme overcrowding in the long duration trade, severe factor crowding in quantitative funds, built-up massive crash hedges, all in a market with low liquidity and poor market depth. It was a completely one-sided trade gone wrong.
Post-election results and post-vaccine news, the market action may be best described as a "quant quake." Several multi-standard deviation price movements were observed, some bordering on near mathematically impossible among the factor returns. Such violent moves are a sign of a market caught well offside and in the grasp of an equally fierce short squeeze exasperated by a thin market. As funds scrambled to reposition desperately, every safe haven (bonds, cash and gold) was reduced with the proceeds redeployed toward the reflation trade. At that point, it was immaterial whether a "real reflation" event was occurring; the pain trade dominates everything and overshoots will happen as funds get squeezed. We see gold's move from $1,950 to $1,777 as collateral damage in the flow-driven short squeeze and quant quake (Figure 1).
Figure 1. Gold Bullion at 200-Day Moving Average (DMA) and Trendline

Source: Bloomberg. Data as of 12/01/2020.
Gold Bullion Long-Term Secular Drivers
This sell-off in gold is its first real drop since the March lows, but gold's macro fundamental drivers are not the cause. The short squeeze was not a sign of a macro breakdown. Money supply and the Federal Reserve (Fed) balance sheet have reached new all-time highs. From the May levels (post liquidity surge), the Fed balance sheet and M27 are still outpacing any prior COVID growth rate (Figure 2).
If we use the consensus view of $1 trillion in fiscal stimulus for 2021, this high money supply growth rate will continue in 2021. The U.S. dollar (USD), as measured by the DXY, is making new lows. A more robust global growth outlook is viewed as leading to further USD weakness. As the global recovery takes hold and resumes, the need for USD funding will decline. Real interest rates will keep falling, especially at the short end curve as the Fed has gone the AIT (average inflation targeting) route. For example, to drive home the point, if the Fed does not hike interest rates until inflation exceeds 2%, the real Fed Funds Rate will be -2%. With WAM (weighted average maturity) extension expected by the December FOMC (Federal Open Market Committee) meeting, we will likely see the long end contained and if breakevens rise, real yields as a result will fall. We already see signs of this move as shown in Figure 3.
Figure 2. Fed Balance Sheet and U.S. M2 Money Supply at All-Time Highs
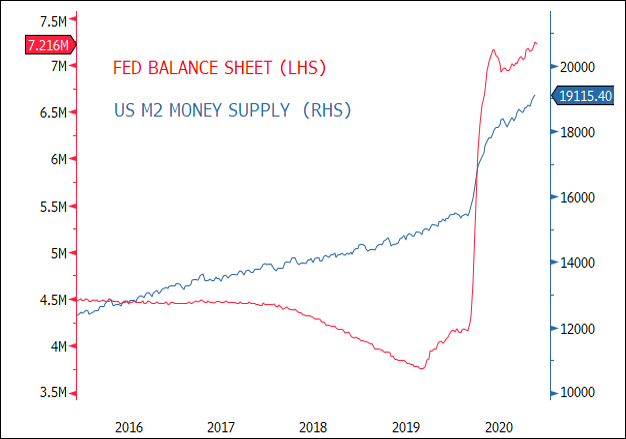
Source: Bloomberg. Data as of 12/01/2020.
Figure 3. U.S. Dollar Making New Lows, U.S. 10-Year TIPs8 Yield (Real Yields) Breaking Short-Term Uptrend
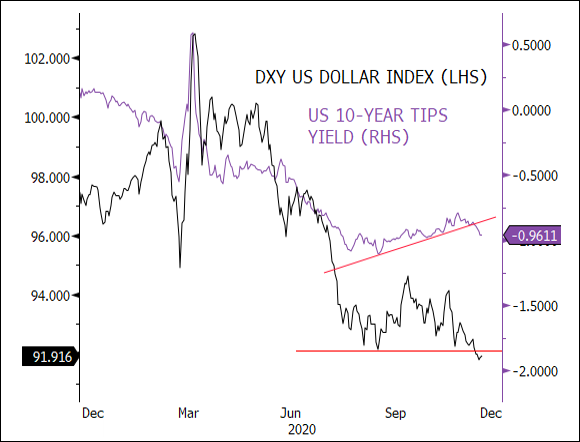
Source: Bloomberg. Data as of 12/01/2020.
A Revisit of the Long-Term Gold Theme and a Tale of Tails9
Since the global financial crisis (GFC), the most significant risk has been solvency risk due to the extraordinary debt amounts at all levels. Pre-COVID, debt levels and leverage by any measure, far exceeded GFC levels. COVID starkly exposed the vulnerability of the financial system in quick order. In a matter of weeks this past spring, global central banks printed more than $12 trillion in liquidity, multiples of the GFC (Figure 4). The solvency risk situation is now the worst in history. As the GFC has demonstrated before, there is no real solution for solvency risk, only liquidity to delay the onset. If extraordinary amounts of liquidity could have created wealth, value or economic growth, the rewards would have been reaped during the past decade (Figure 4).
Figure 4. Combined Balance Sheets of U.S. Federal Reserve, European Central Bank (ECB) and Bank of Japan (BOJ)

Source: Bloomberg. Data as of 12/01/2020.
A Deflationary Feedback Cycle
The central bank response of greater liquidity and lower yields to force capital into risk assets and spur economic growth to outpace debt has not worked in the past decade. What has happened instead is almost the opposite, a deflationary feedback cycle. It goes something like this: lower yields lead to suppressed default rates and increased excessive capacity, which drive yields lower. For example, in 2020, to prevent bankruptcies (and avoid a depression), the Fed has promised the credit market a backstop for corporate issuers. The result is over $2.2 trillion of debt added to corporations thus far in 2020 alone.
Corporate debt to gross domestic product (GDP) is now the highest ever, another addition to the solvency risk bucket. Capital is now flowing into unproductive businesses and increasing excess capacity. Excess capacity is deflationary, leading to lower yields. Low yields raise investors' need for higher-yielding junk bonds, and in turn, prop up more failing businesses resulting in additional excess capacity. The deflationary debt cycle continues.
The Bar is Being Lowered for More Extreme Risk Outcomes
There are two extreme outcomes at the end of the risk chain: a deflationary bust (the left tail) or an "inflationary blowout" (the right tail). In plain English: The tails on the far left and far right represent the least likely but most extreme outcomes. This inflationary blowout is not the common CPI (consumer price index) kind, but the debt jubilee (a clearance of debt, aka debt forgiveness or restructuring) and the extreme expansion of fiat-money-kind of blowout. The pandemic's effects in the spring of 2020 would be an example of a massive deflationary shock and gold's reaction to the shock was the expected response. The sudden decline in economic output spurs central banks to flood liquidity, collapse interest rates and unleash all manner of swap and credit facilities to ensure the continuation of functioning financial markets.
It is debatable whether central banks have run out of bullets, but there is little doubt that they have hit diminishing returns long ago. If the next shock occurs, it will likely exceed the COVID-level response just as the initial COVID response exceeded the GFC response. The stockpiling and compounding of legacy risks in the form of ever-greater debt levels ensure the reaction function will be greater than the last shock event. In other words, the bar is continuously being lowered for more extreme risk outcomes.
The inflationary blowout/debt jubilee/fiat money reset scenario is more challenging to envision because of its rarity (the last example was the end of Bretton Woods in the early 1970s). For the past four decades, secular deflationary forces have dominated. Due to QE's (quantitative easing) limitations, money printed is mostly stuck in the financial system, as evidenced by the near complete collapse of the velocity of money and the ballooning of financial asset prices. Ironically, a likely scenario for the right tail risk event would be another deflationary shock that forces full-on money printing. Because of the compounding of past excesses, the zero bound and the diminishing returns on central bank liquidity injections, a debt jubilee or full-on MMT (modern monetary theory) type money printing has moved up the probability curve.
Policymakers and the winds of social change will likely determine whether it will be a left or right tail outcome. Social change is complicated to assess, but QE's effects (driving up asset prices to extreme levels but with a limited modest impact on the real economy) have created the most massive income and wealth disparity in history.
The vast majority of the population are in the have-not group saddled with debt but little financial assets, looking at inflated home prices while having no jobs or a subsistent employment level. From that perspective, an "inflate all away and reset it to zero" populist revolt has many historical precedents. For the minority with accumulated wealth, a "defend asset prices at all cost" would be the counter. There is not a lot of middle ground here. It is a complicated and risk-laden confluence of economics, politics, policies, social and cultural forces.
Gold Bullion: The Rare Right Tail Risk Hedge
For almost 40 years, bonds were one of the best tail hedges – deep, liquid, and the Fed liquidity function's primary beneficiary. But with ZIRP (zero interest rate policy) and the long end under compression from Fed policy (AIT), the ability for bonds to act as a "put option" is gone. Bonds will still have a role and function as a portfolio diversifier, but its best days as an effective hedge has ceased. As a left tail hedge, it is limited due to the zero bound. Bonds cannot function as the right tail hedge; it would be the worst asset class in this scenario.
The ability to hedge the right tail scenario is very challenging, even for sophisticated funds. Under the right tail risk scenario, the economic and capital market outlook would offset hard assets' valuation. A long volatility strategy may be useful but is limited to very sophisticated funds. A long volatility strategy would also be expensive as positive carry disappeared a decade ago. Gold is the only effective right tail hedge for the majority of funds and individuals. Gold is liquid, has no carrying cost, is easy to understand and has a long proven history against this type of tail risk that spans many centuries.
Pre-GFC, the probability of the right tail risk described above was remote at best, akin to science fiction. Post-GFC and pre-COVID, it was a possibility but rather unlikely. Post-COVID and with the entire world at the highest leverage-to-debt ever, it is now firmly possible though obscured by the sheer level of central bank liquidity. If there is another deflation shock, then the probability curve shifts higher again. The nature of this right tail risk is a significant wipeout of wealth, and history is replete with such examples. For large funds and wealthy individuals, this tail risk cannot be ignored entirely as the consequences are existential for capital preservation. Most funds are short volatility type funds from a risk point of view and have very little if any long volatility tail protection for either of the described left or right scenarios. The surge in gold holdings is early recognition of this risk, but gold still remains well under-owned.
Gold: Right Tail Optionality, Convexity and Lower Volatility
Gold price behavior under the right tail risk scenario will be different; it will likely feature very high levels of convexity. The first will be price movement similar to what we have seen this year. The second feature will probably be heavy call option buying and the accompanying dealer gamma hedging driving prices higher (i.e., Nasdaq summer 2020 type action). The third will be volatility expansion similar to the late 1970s when realized volatility tripled.
Holding gold in a diversified portfolio has a long history of lowering overall volatility and improving efficiency. As a left tail hedge against a deflationary shock, gold has now likely surpassed bonds as well. But as a right tail hedge, there is no other asset other than gold that we believe provides right tail optionality with convexity.
| 1 | Gold bullion is measured by the Bloomberg GOLDS Comdty Index. |
| 2 | Spot silver is measured by Bloomberg Silver (XAG) Spot Rate. |
| 3 | Sprott Gold Miners Exchange Traded Fund (NYSE Arca: SGDM) seeks investment results that correspond (before fees and expenses) generally to the performance of its underlying index, the Solactive Gold Miners Custom Factors Index (Index Ticker: SOLGMCFT). The Index aims to track the performance of larger-sized gold companies whose stocks are listed on Canadian and major U.S. exchanges. |
| 4 | VanEck Vectors® Gold Miners ETF (GDX®) seeks to replicate as closely as possible, before fees and expenses, the price and yield performance of the NYSE Arca Gold Miners Index (GDMNTR), which is intended to track the overall performance of companies involved in the gold mining industry. The SPDR Gold Shares ETF (GLD) is one of the largest gold ETFs. |
| 5 | The U.S. Dollar Index (USDX, DXY, DX) is an index (or measure) of the value of the United States dollar relative to a basket of foreign currencies, often referred to as a basket of U.S. trade partners' currencies. |
| 6 | The S&P 500 or Standard & Poor's 500 Index is a market-capitalization-weighted index of the 500 largest U.S. publicly traded companies. (TR indicates total return and reflects the reinvestment of any dividends). |
| 7 | M2 is a measure of the money supply that includes cash, checking deposits, and easily convertible near money.M2 is a broader measure of the money supply than M1, which just includes cash and checking deposits.M2 is closely watched as an indicator of money supply and future inflation, and as a target of central bank monetary policy. |
| 8 | Treasury inflation-protected securities (TIPS) are a type of Treasury security issued by the U.S. government. TIPS are indexed to inflation in order to protect investors from a decline in the purchasing power of their money. |
| 9 | Tail risk is a form of portfolio risk that arises when the possibility that an investment will move more than three standard deviations from the mean is greater than what is shown by a normal distribution. Tail risks include events that have a small probability of occurring, and occur at both ends of a normal distribution curve. |
Don’t miss a golden opportunity.
Now that you’ve gained a deeper understanding about gold, it’s time to browse our selection of gold bars, coins, or exclusive Sprott Gold wafers.


About Sprott Money
Specializing in the sale of bullion, bullion storage and precious metals registered investments, there’s a reason Sprott Money is called “The Most Trusted Name in Precious Metals”.
Since 2008, our customers have trusted us to provide guidance, education, and superior customer service as we help build their holdings in precious metals—no matter the size of the portfolio. Chairman, Eric Sprott, and President, Larisa Sprott, are proud to head up one of the most well-known and reputable precious metal firms in North America. Learn more about Sprott Money.
Learn More
You Might Also Like:

Looks like there are no comments yet.