


Did you know you can get the Sprott Money Weekly Wrap Ups, Ask The Expert,
special promotions and insightful blog posts sent right to your inbox?
Sign up to the Sprott Money Newsletter here.
Last weekend, I published an article entitled: “Data Warns of an Imminent Peak in Gold.” The following explains why…
Seldom does a market go straight up, in a word parabolic. We know this is rare because we remember such moves no matter how many years ago: “Tulip Mania” anyone? Primary examples are two such moves in Bitcoin since inception. The blow-off top in Gold in 1980 is another. But is this another such move in Gold today? I doubt it. Although I believe Gold and the rest of the sector are going much higher, this does negate short-term reversals, which in fact are healthy to support the continuing up trend. I’ll explain why…
I decided to compare all of the indicators in this current wave (1) of wave 5 to wave (1) of wave 3 from Aug'18-Feb'19 and all of wave 1 from Dec'15-Jul'16. While the results were not definitive, there were some very interesting takeaways.
The sample size may be small but the fact that these rallies are part of the same bull market that began in December 2015 and are recent, increases the significance of the results.
The first data point in favor of further gains to come is that the rally began on Nov 3 at 1618, when the Fed confirmed the pivot -i.e. lower rate hikes- and its duration has only been 87 days so far. The duration of Wave (1) of 3 in 2018/2019 was 188 days, more than double. All of wave 1 in 2015/16 was even longer at 229 days.
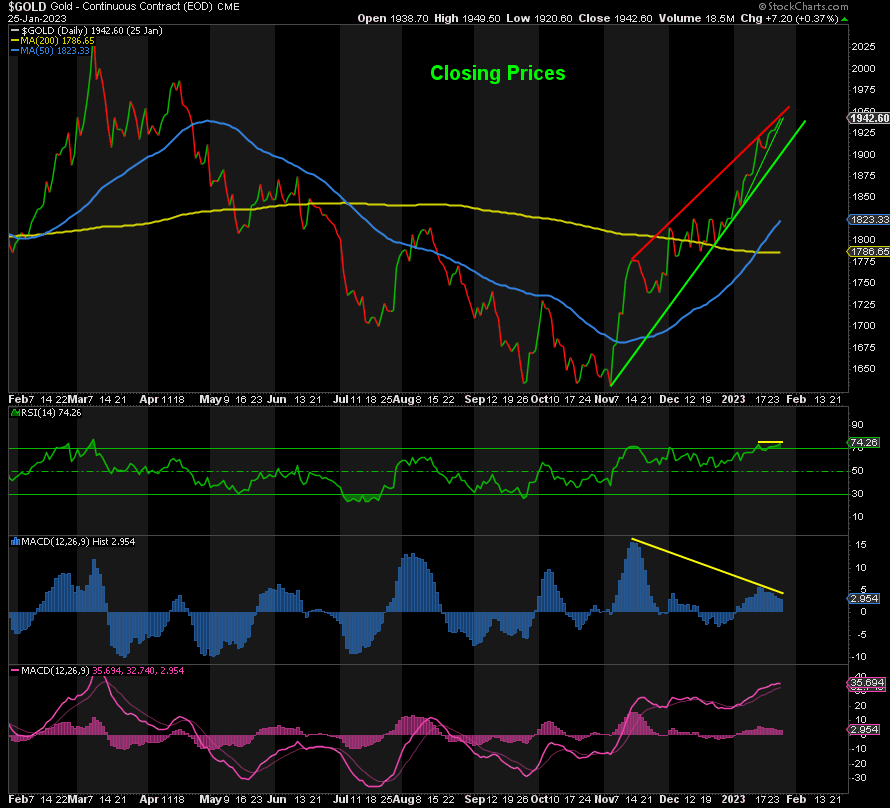
However, the brevity of this rally and its strength may work against it also. It’s obviously in a steep ending diagonal and they can break quickly to the downside, as fast or faster than the rally that preceded it:
The prior rallies were in channels, which would explain their greater longevity.
Now for the truly interesting data points…
The current extreme bullishness we’re seeing is now higher than that at 2079 in March 2022. It is also greater than the peaks in the prior Wave 1s in 2018 and 2016. Remember, the previous wave 1s stopped at these levels and head south for a “pullback”.
Switching to the technical indicators… What I look for are over-extended peaks and/or negative divergences. Below is the raw data, which I’ll explain:
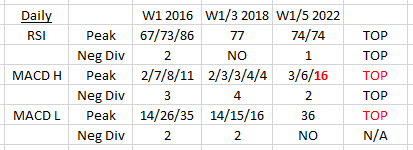
The current daily RSI is extreme overbought AND negatively divergent. Now this does not negate the possibility that the RSI continues higher to the 77 seen in 2019 or even the 86 seen in 2016 before succumbing to the downside. But you can clearly see that the current reading is sufficient for a peak based on prior peaks.
The MACDs are even more emphatic than the RSI is in signaling a pending peak.
The MACD Histogram is coming off a level of 16, the highest level since the peak of 2089 in August 2020, the peak of wave 3! That’s profound by itself. But we’ve had 2 negatively divergent lower peaks of 6 and 4 since then while the price of Gold continued to rise. This doesn’t bode well. The prior rally peaks had similar negative divergences but from nowhere near the peak of 16 this time around. Simply put, the daily MACD Histogram is more bearish than the MACDs at the prior two wave 1 peaks and the peak in August 2020 at 2089.
As for the MACD Line, it’s at 36. The MACD has only been higher at the peaks of 2079 in March 2022, 2089 in August 2020, and 1923 in Sept 2011. And this is just the first wave! However, it does not have the negative divergences that previous Wave 1 rallies had, so they could still be ahead. But again, although the MACD Line may not be done on the upside, the MACD Line at 36 is clearly sufficient for a peak here in Gold.
In summary, these indicators, especially the MACD Histogram, which is shorter-term focused than the MACD Line, are more than sufficient for an imminent peak in Gold. That said, there’s no rule against them going somewhat higher.
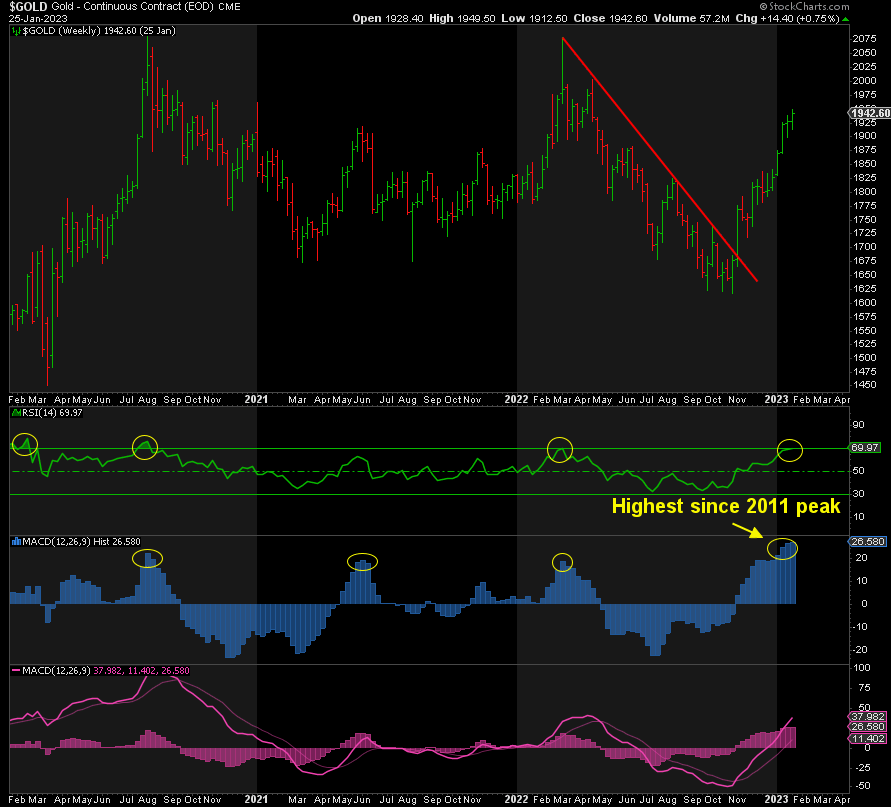
Now for the weekly indicators…
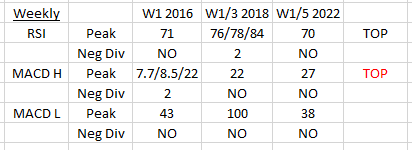
Starting with the RSI, it’s overbought too, and is just a point away from the peak in July 2016. But it has no negative divergences. The peak of the 2018 rally was far more profound. But as it stands, the weekly RSI is also high enough for a peak in Gold, but obviously it could still go higher and incur negatively divergent higher highs along the way.
The MACD Line is also shy of the 2016 peak and well below the 2018 rally peak (in August 2020). But take note that that “100” reading was only topped once in the past 40 years, and that was when Gold peaked at 1923 in 2011 before falling to 1045 over the next 4 years. The current reading of 38 is the highest since the peak of 2079 in March 2022, so while it may look small relative to 2018, it is high enough to signal a “short-term” top in Gold.
Saving the best for last, like the MACD Histogram on the daily chart, the weekly MACD H is the highest since the 2011 peak at 1923. Think about that for a second and then tell me how this is NOT sufficient for a peak of the current wave 1 in Gold. Frankly, one could argue is damning for Gold! We all know what happened after the peak in 2011, a 4-year bear market when Gold dropped 46%. I don’t expect that this time around, far from it, but it certainly justifies a garden variety pullback.
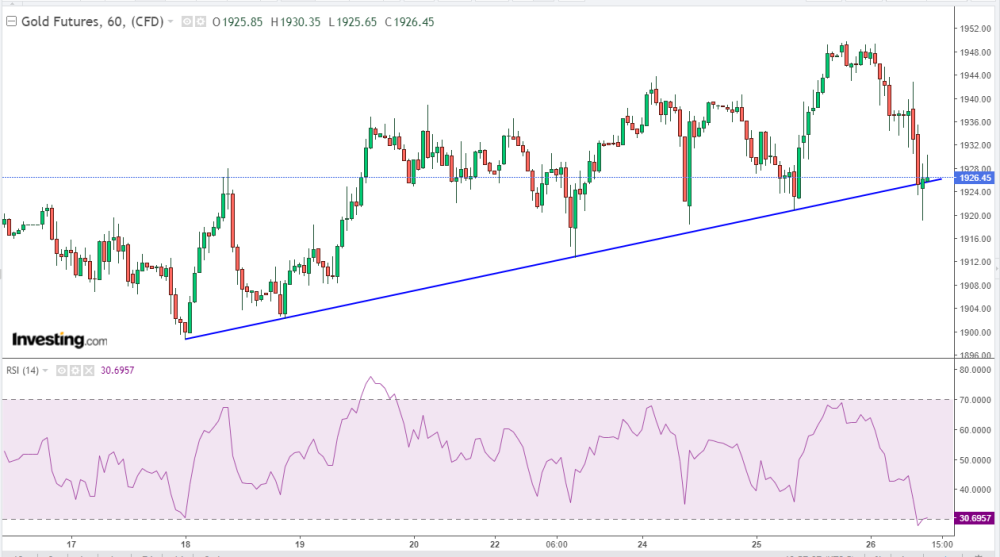
Fast forward to today, and Gold tagged strong resistance at 1950. Given the extremities in sentiment, the daily and weekly RSIs, coupled with those in both MACDs, it signals a high probability that a “short-term” peak is in for now. All we need is a break of support, and perhaps that is what is just about to happen:
In conclusion, sentiment and the daily and weekly technical indicators make a strong case for a short-term peak in Gold, based on similar major peaks in the recent past.
Perhaps, now you understand why I remain bearish in the short-term while my outlook is for far greater gains in Wave (3) and (5) of this Wave 5 that still lay ahead. It’s based on “the data”, not hope, not bias, but data.
I’m not going to go into the COT data which is also sufficient for a short-term peak and pullback but allows for further gains too. In a nutshell, it is not as definitive as the other data.
On a final note, Wave 3 and Wave 5 tend to be very similar in size, i.e. percentage gains. In the current wave (1) of 5, Gold has gained 21%, already surpassing the 16% in wave (1) of 3 in 2018/19. Note, that Wave 3 rose $922 or 80%! How much more do you think Gold can go in this wave (1) rally?
Finally, Gold can continue higher, but the data says the odds are increasingly in favor an imminent pullback. This is even more likely if the DXY rises too. I'm not sure the JPY is out of the woods yet and the EUR looks soft here too, which tells me the DXY is about to rebound, finally. When that happens, Gold won't be able to escape it imho. Silver and the miners neither.
Then back up the truck for what happens next. Allow me to make this crystal clear: I am not recommending anyone short a bull market. I am waiting to buy the dips, especially meaningful declines.
My forecasts for the peak of this Wave 5 are 2300+ in Gold and ~40 in Silver, and I believe they are “conservative”. So, you need to have a core long position set up already, and if not, get on it sooner rather than later. Preferably, following an imminent pullback
Don’t miss a golden opportunity.
Now that you’ve gained a deeper understanding about gold, it’s time to browse our selection of gold bars, coins, or exclusive Sprott Gold wafers.


About Sprott Money
Specializing in the sale of bullion, bullion storage and precious metals registered investments, there’s a reason Sprott Money is called “The Most Trusted Name in Precious Metals”.
Since 2008, our customers have trusted us to provide guidance, education, and superior customer service as we help build their holdings in precious metals—no matter the size of the portfolio. Chairman, Eric Sprott, and President, Larisa Sprott, are proud to head up one of the most well-known and reputable precious metal firms in North America. Learn more about Sprott Money.
Learn More
You Might Also Like:

Looks like there are no comments yet.