


Did you know you can get the Sprott Money Monthly Wrap Ups, Ask The Expert,
special promotions and insightful blog posts sent right to your inbox?
Sign up to the Sprott Money Newsletter here.
Oh, boy. Here we go again. It's the start of a new year, and that means it's time for another adventure in long term price forecasting. Around here we call it a "macrocast" because we figured out long ago that, in a world dominated by computers trading derivatives, if you can get the macroeconomic conditions right, you've got a decent shot at forecasting the gold price, too.
Well…most of the time. Our track record in these forecasts had been pretty good until 2021. The macroeconomic conditions had promoted stability for gold prices in 2017 and 2018. The Fed's monetary policy then changed in late 2018, and this promoted positive gold prices in 2019 and 2020. Here are some summaries and links to past reports:
- As 2017 began, we were told that the election of Trump would crash gold prices due to a soaring dollar, a surging U.S. economy, and a bursting of the bond bubble. This narrative seemed ridiculous at the time, and we were right...it was. And we wrote about it on January 17, 2017: Questioning The Generally Accepted Narrative
- The following year, even more supposed experts were calling for triple-digit gold prices and a resumption of the bear market. They were proven wrong. At TFMR, we expected prices to be steady and rising instead as three themes would support prices. This was posted on January 4, 2018: The Three Themes of 2018
- In early 2019, all the eight-figure Wall Street economists were insisting that gold would crash as the Fed hiked rates as many as four times in 2019. These same clowns expected the yield on the U.S. 10-year note to rise to 5%! This was utterly ridiculous for reasons we've discussed at TFMR for over a decade. So instead, we figured that 2019 would play out a lot like 2010 and forecast "the best annual gains since 2010" in this post from January 14, 2019: 2010 + 9
- And in 2020, we knew the macro conditions that prompted the breakout and renewed bull market of 2019 would continue. Thus it was entirely logical to predict another 20% rise in COMEX gold and an even greater percentage rise in COMEX silver. What we couldn't have anticipated was The Covid Crisis, and as such, price overshot our goals by considerable margins. In the end, COMEX gold posted a gain of 25% and COMEX silver rose by 48%: 2020 Foresight
But 2021 was a different animal. Since June of 2020, we've discussed stagflation as the likely ultimate economic outcome of The Covid Crisis. We expected price inflation to accelerate, and it did. We expected nominal interest rates to remain low, and they did. We expected real interest rates to move sharply negative, and this happened, too. And with all of this in play, we expected a further rise in precious metal prices. Oops. For the first time in five years, we really blew it: 2021: A Gold Odyssey
However—and this is important—the only thing we got wrong was price. All the other macro factors were spot on. Now, of course, in the moment, price is always most important. But history has taught that price inefficiencies do not persist indefinitely, so if the macro factors continue to trend in our direction in 2022 then we must expect price to eventually adjust to the economic reality.
To that end, what are those all-important macro factors for the year ahead? Well, let's list three of them.
- Fed policy. As I type, the fed funds futures market is implying as many as three fed funds rate hikes in the year ahead. Chief Goon Powell himself intimated as much at the December 2021 FOMC meeting. So, will fed funds be pegged at 0.75-1.00% by December 2022?
- Nominal interest rates. Many of those same eight-figure Wall Street economists mentioned in 2019 are again expecting a surge in long-term interest rates this year. Some are saying that the yield on the ten-year U.S. treasury note might reach as high as 3.0%. Could that be possible?
- Real interest rates. Here's the tricky one. The Fed has convinced/fooled the supposed experts into thinking that the price inflation of 2021 was "transitory" and that annualized CPI will soon fall back toward 3% or even lower. What's the likelihood of that?
Now let's take these one by one and see if we can begin to formulate a coherent 2022 forecast.
First, let's look at Fed policy. Again, the current forecast is for three rate hikes in 2022. Might that happen? Of course. Will it happen? I doubt it. Why? As recently as last July, The Fed was stating that there would be no fed funds rate hikes until 2023 and they weren't even discussing yet a taper of their current QE program. So, the point is that things can change pretty fast.
Short rates are already moving up at a much faster pace than long rates, and this flattening of the yield curve is leading many to conclude that the Fed is on a path to a "policy error" that will actually lead to a recession by later this year. Well, if that's the case, the Fed might just as easily reverse course as quickly as they did in late 2021. Is the January 2022 gold price reflecting this possibility? Nope.
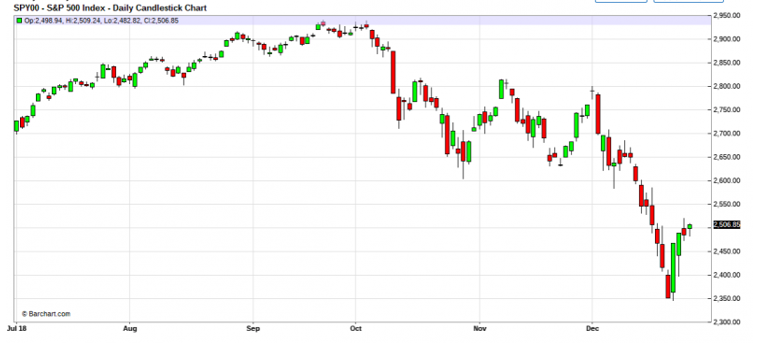
Next, let's discuss nominal interest rates, particularly on the long end. Again, many economists are forecasting rates at 3.0% (or even higher) in the year to come. Have they forgotten what happened the last time the Fed tried to get rates that high and run off their balance sheet? Below is a chart of the S&P 500 in the back half of 2018. That's a drop of over 20% that was only halted and reversed after a Christmas Eve meeting of the President's Working Group on Financial Markets: Mnuchin speaks with US bank executives to reassure investors after Wall Street whiplash
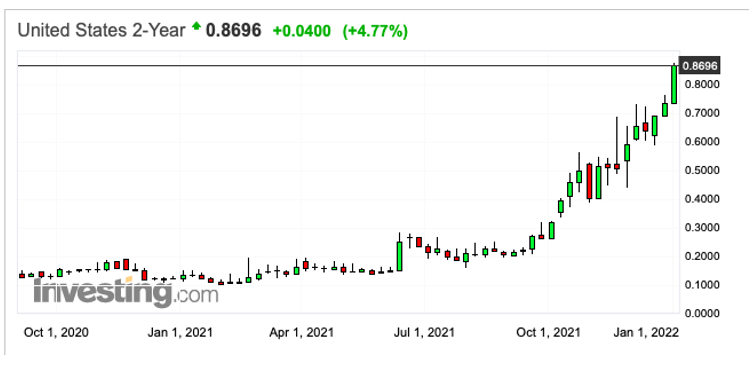
Additionally, like U.S. consumers, corporations, municipalities, and states, the U.S. government cannot afford higher long term interest rates. With a current total deficit nearing $30 TRILLION, the line-item cost of servicing this debt is approaching $500 BILLION/year. If nominal rates move higher toward 1.50% on the two-year and 3.0% on the ten-year, the U.S. debt service cost will move toward $1 TRILLION/year. This would only serve to spin the current Ponzi scheme even faster, and policymakers will seek to avoid this fate for as long as possible.
So, it's pretty clear that forecasts of sharply higher nominal interest rates this year are way off base and very unlikely to be proven correct. Is the January 2022 gold price reflecting this possibility? Nope.
And finally, let's look at inflation-adjusted or "real" interest rates. Historically, real rates have about a 95% correlation with gold prices, so it's pretty important to get this right. In 2021, however, it was clear that "the markets" now ignore present day inflation, choosing instead to focus upon longer-term inflation expectations when calculating real rates. Let's discuss those longer-term expectations.
The Fed itself has always stated that it takes at least six to nine months for monetary policy changes to have an economic impact. So, using this logic, any fed funds rate hike in June of 2022 won't materially impact inflation until early 2023. And if that's the case, there is going to be at least a full year ahead of price inflation and this will definitely impact the expectation of further and continuing price inflation for the years that follow.
As you can see below, the Fed itself currently measures five-year inflation expectations at 2.95%. The longer price inflation remains unrestrained by Fed policy, the more entrenched these expectations will become and they will climb even higher, too.
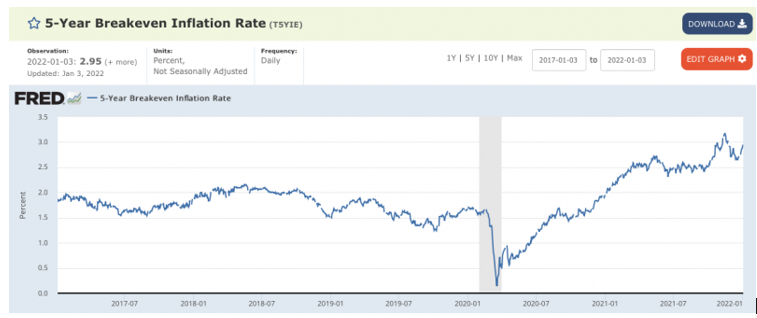
As you calculate the inflation-adjusted or "real" interest rate off of these inflation expectations, you'll notice the glaring anomaly of 2021, caused by the Fed convincing the market that all of this was “transitory”.
- August 2020. Inflation expectation of 1.65%. U.S. 10-year note yield 0.55%. Implied real interest rate of -1.10%. Gold price of $2080.
- January 2022. Inflation expectation of 2.95%. U.S. 10-year note yield 1.60%. Implied real interest rate of -1.35%. Gold price $1800.
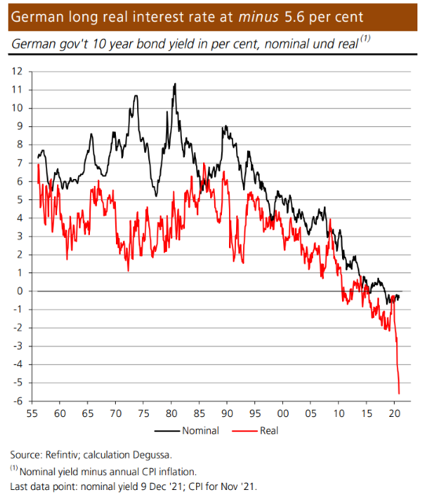
And negative real rates are not just an American problem. Real rates are sharply negative around the globe, particularly in Europe where the ECB has boxed itself in with regards to its monetary abilities. All they can do is print and use the proceeds to buy debt. This keeps a lid on nominal rates while price inflation continues to rise. The Germans and the Swiss have long been hoarders of physical gold due to their experience with historic periods of hyperinflation. Will their demand for physical gold continue to grow if the trend shown below continues?
So, it would seem pretty clear that gold is underpriced versus real interest rates. Given the economic environment, real interest rates may continue to decline in 2022. Is the January 2022 gold price reflecting this possibility? Nope.
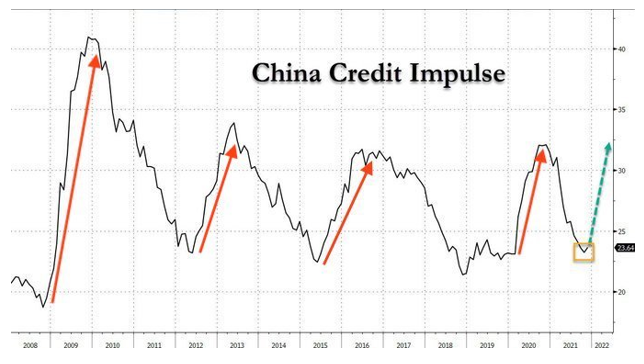
And there's one other factor that requires a mention before we get to the charts and the forecasts. As you may know, Chinese demand is a major driver of commodity prices, and one way to anticipate this demand is through what's called their "credit impulse", which is a sort of secondary measure of tightness in PBOC monetary policy.
As the credit impulse declines, history has shown that commodity prices often fall. The inverse has also shown to be true, however, and what do we see below? As 2021 ended, it appeared that China was ready to open the monetary floodgates again, and this credit impulse had fallen to a point where it had often bottomed in the past. Will a new surge in Chinese buying lead to higher commodity prices in 2022? That sure looks like a distinct possibility. And how have gold and silver prices performed during recent surges in the Chinese credit impulse?
- Late 2008 to early 2010: Gold up over 20%. Silver up 60%.
- April 2012 to April 2013: Gold up just 4%. Silver up 8%.
- June 2015 to August 2016: Gold up over 20%. Silver up 50%.
- February 2020 to November 2020: Gold up over 20%. Silver up 70%.
With all of this in mind—and with an eye to the bruises and scars left from 2021—let's check the charts and come up with some goals for 2022.
Let's start with COMEX Digital Gold because that's what it's all about. The year 2021 was a tremendous disappointment for all of us who hold gold, but as you can see below in the chart provided by Ronni Stoeferle, the losses were pretty consistent across all major fiat currencies and somewhat fit the recent pattern for bull markets.
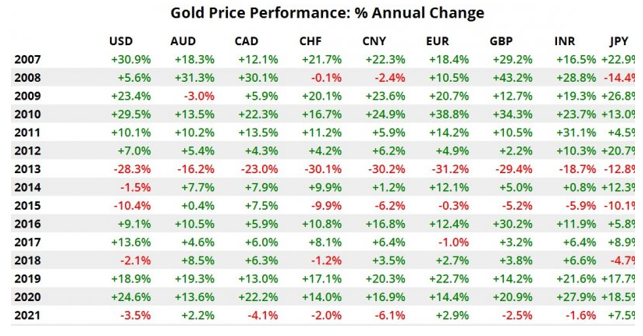
Now be sure to note the period of 2013-2015. Gold posted three consecutive years of losses while in a bear market due to Fed tightening and lack of QE. Is this where we stand in early 2022 or, instead, has The Fed been revealed to be disingenuous in their words? Perhaps gold sees through this and reacts as it often does in bull markets. See 2007-2012 or 2016-present.
In this case, I'm inclined to believe it's the latter and any attempt by the Fed to pretend to "tighten" and "normalize the balance sheet" will ultimately be reversed as equity and fixed income markets collapse in response. The total accumulated debt burden from decades of Keynesian experimentation is simply too great.
But it might take a few months for this to play out. Already in 2022, the Fed surprised "the markets" with their FOMC minutes from December, and this charade may persist through the first few months of the year. But where the Fed fooled everyone for five years in the last decade, their efforts may fail in as quickly as five months in 2022.
Additionally, the last time the Fed went on a sustained path of regular quarterly hikes to the fed funds rate was in the period 2003-2007. The Fed actually hiked fed funds for seventeen quarters in a row! And how did the price of gold respond? It more than doubled over that same period. See below.
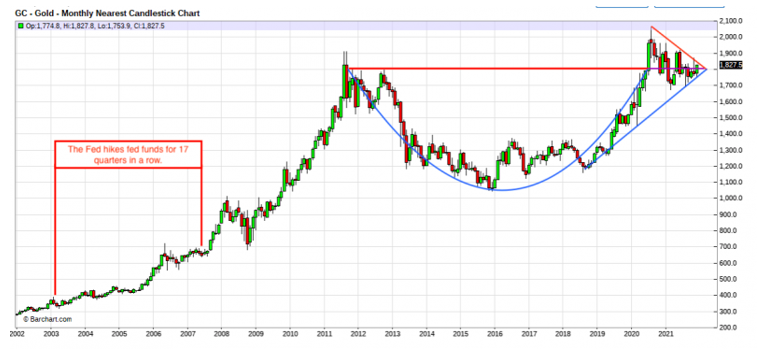
Gold has been trending higher since late 2018 as real interest rates have trended lower. In the first third of 2022, price may continue to struggle as the Fed plays their rhetorical games. Another trip to $1680 may be coming. If things get particularly nasty, gold may even see $1580. HOWEVER—AND THIS IS IMPORTANT—this sort of drop will be the lows of the year if it occurs.
The first thing to watch for as the reversal begins will be a sharp drop in the S&P 500. It took a 20% drop in November 2018 to convince the Fed to reverse course, and it may take slightly more than that in 2022 to accomplish the same. As stocks fall, however, the bond market will reverse due to "safe haven" demand. Lower nominal rates will then reverse the trend toward higher real rates and gold will find a floor.
Take another look at that monthly chart above. Notice that the Fed began to shift policy in December of 2018 but it wasn't formalized into a rate cut regime until June of 2019. Those intervening six months saw gold rally from $1160 to $1360. The fed funds rate cuts that began in June 2019 then drove price to $1560 by early September. This is your most likely historical basis for what to expect from gold in 2022.
In short, the first four months of 2022 will be challenging, with gold behaving much as it did during the entirety of 2021. However, the trend will finally change during the period from May-August and price will begin a recognizable trend higher. And then, in the final four months of the year, gold will shine with prices back above $2000 and threatening the all-time highs of August 2020.
Price began 2022 at $1830. It may soon dip toward $1700, but it will again find support near that level. From there, some higher highs will finally appear on the daily chart, and this will get the attention of the hedge funds and the generalists. Momentum and sentiment will turn higher and gold will rally further, ending the year at $2050. That would be just a 12% gain, and if you look again at Ronni's chart, that would be pretty close to the recent 15-year average. I may be low-balling it a little bit, but after the frustration of 2021, can you blame me?
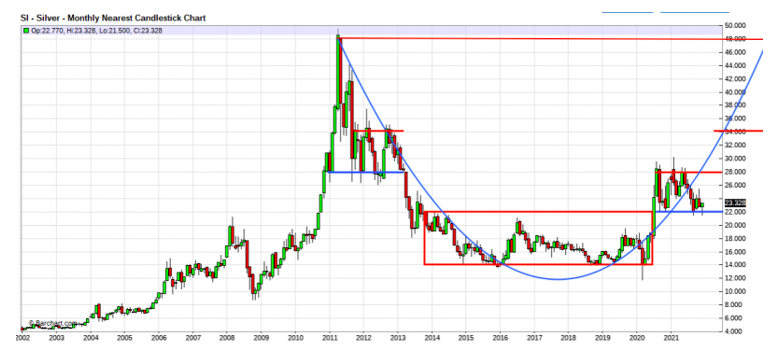
Now let's turn to COMEX Digital Silver.
The first thing you should do with silver is take a look at your price expectation for gold and then double it. That's a pretty good rule of thumb, whether price is moving up or down. So, if we expect a 12% gain in gold then we should look for something like 25% in COMEX silver. That sounds about right. If we add 25% to the 2021 close of $23.50, we get something around $29. As we begin 2022, I suppose many of us would be just fine with that.
However, if we're right about that Chinese credit impulse and the Fed reversing their tightening rhetoric by later this year, silver could/should do better than +25%. Again, scroll back up and look at the gains accrued during periods when the Chinese credit impulse was pointed upward. With this in mind, what does the chart suggest?
Well, don’t forget that the first four months of this year could be pretty challenging, and at TFMR, we've been concerned that any sustained breakdown through $22 would very likely lead to a gap-fill on the daily chart, with a move down to the $19.50-20.00 area. This move would be brief and would very likely mark the lows of the year IF it happens.
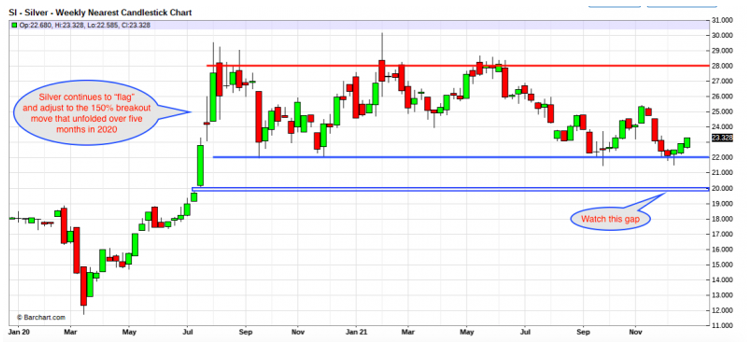
But once sentiment and momentum turn, the move to the upside will be significant. The "swap dealing" Banks ended 2021 with a net short position of just 5,000 contracts. How many contracts net long will these Banks be if/when price fills that gap and briefly falls below $20? Take a look at the chart below and, in your mind's eye, project it forward. I'll stick with $29 as my goal for year end, but you can plainly see where $34 is not out of the question, and that's a number that would certainly be in line with past rallies associated with Fed reversals and/or Chinese credit binges.
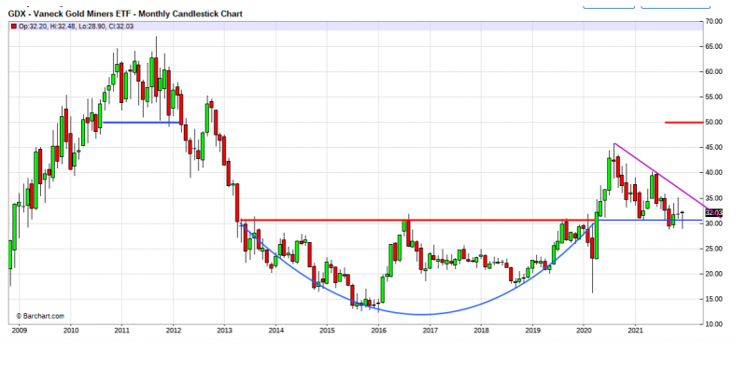
And we might as well take a stab at the mining shares, too. The year 2021 was nasty and no fun as the shares consolidated after FINALLY breaking out of a seven-year stagnation. As you can see below, the chart presents a classic cup-and-handle formation, and these usually resolve to the upside. So, if we expect gains in both COMEX gold and COMEX silver in 2022, why wouldn't we expect gains in the mining sector? Like silver, the shares should move at a greater percentage clip than gold, so if we are correct about $2050 and $29, why wouldn't we look for something like $45-50 in the GDX?
The key will be the "handle" or "bull flag" on the chart below. Once that purple line is broken, the target will become $40 and, once above there, the $46 highs of August 2020. A return to the 2020 highs may sound frustrating to many of the diehards in the sector but, after 2021 and as 2022 begins, would you take it? I sure would!
So that's it. I've placed my head directly upon the chopping block again, and I invite any and all criticism if this year's macrocast fails to play out as expected. But the year 2022 promises to be wildly volatile and unpredictable, so we'll see where it takes us. Just one thing is certain as the year begins: Economic reality is going to bite a lot of people who enter 2022 under the false assumption that they've got it all figured out and everything is under control.
If I'm right about the ultimate direction of precious metal prices, we'll all be richly rewarded for our patience. If I'm wrong, just consider this another entry in the long list of lunatic ramblings posted by your infamous "dope with a MacBook".
Good luck, everyone!
TF
Don’t miss a golden opportunity.
Now that you’ve gained a deeper understanding about gold, it’s time to browse our selection of gold bars, coins, or exclusive Sprott Gold wafers.


About Sprott Money
Specializing in the sale of bullion, bullion storage and precious metals registered investments, there’s a reason Sprott Money is called “The Most Trusted Name in Precious Metals”.
Since 2008, our customers have trusted us to provide guidance, education, and superior customer service as we help build their holdings in precious metals—no matter the size of the portfolio. Chairman, Eric Sprott, and President, Larisa Sprott, are proud to head up one of the most well-known and reputable precious metal firms in North America. Learn more about Sprott Money.
Learn More

You Might Also Like:

Looks like there are no comments yet.