


Did you know you can get the Sprott Money Weekly Wrap Ups, Ask The Expert,
special promotions and insightful blog posts sent right to your inbox?
Sign up to the Sprott Money Newsletter here.
Everything is lining up for a sustainable low in precious metal and miners: technicals, sentiment, positioning, Fibonacci levels, and inter-market analysis. A fundamental catalyst for the start of the coming rally would be ideal but not required. Gold tends to anticipate such a catalyst anyway, as it did in 2008 and on several other occasions. This week, courtesy of my FIPEST xM process, I am going to focus on the various signals I am watching to tell us the bottom is in and a massive new rally to highs exceeding those in 2020 has begun.
I will be using Gold as a proxy for the entire sector.
INTER-MARKET ANALYSIS
This refers to other assets that can have a significant influence on precious metals and miners, such as the dollar index, or “DXY”, and bond yields.
DXY
Although correlations do come and go in the short-term, typically Gold is negatively correlated to DXY, i.e., when DXY rises, Gold falls—and vice-versa when DXY falls. The negative correlation on a 20-day basis is currently -0.91, a near perfect inverse correlation.
The DXY just broke out to the upside to its highest level since September 2020. But it is extreme overbought on a daily basis with an RSI over 70.
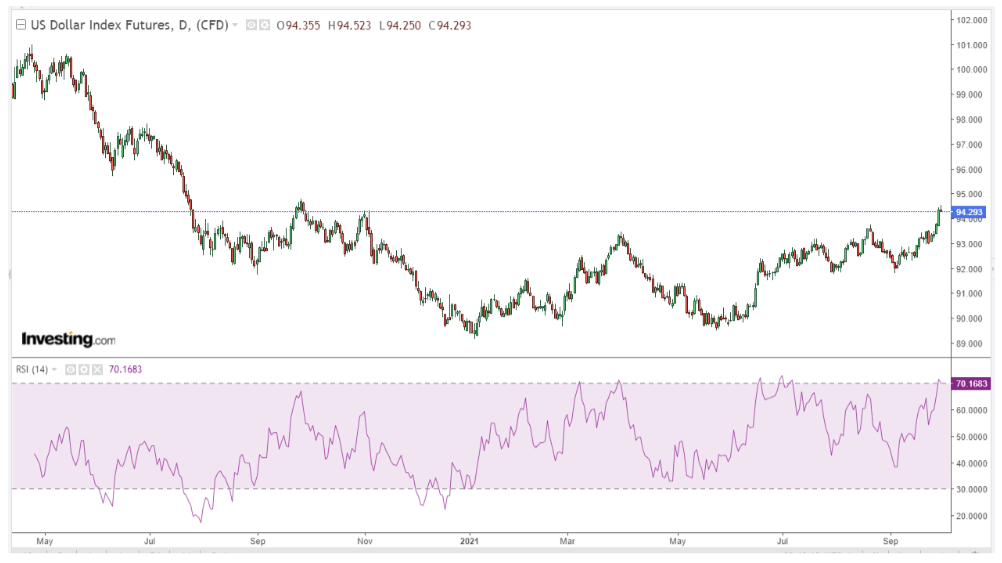
Although this may trigger a short-term pullback, the DXY can remain extreme overbought for quite some time, just as it did in 2014:
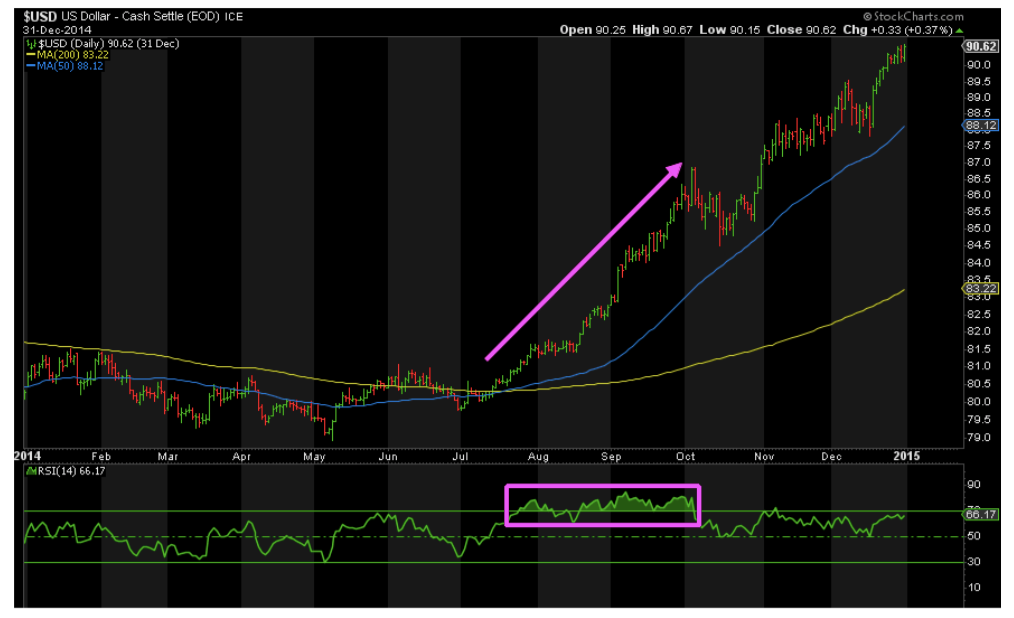
It often hits a negatively divergent higher high before peaking. This means that the DXY can continue higher from here despite being overbought.
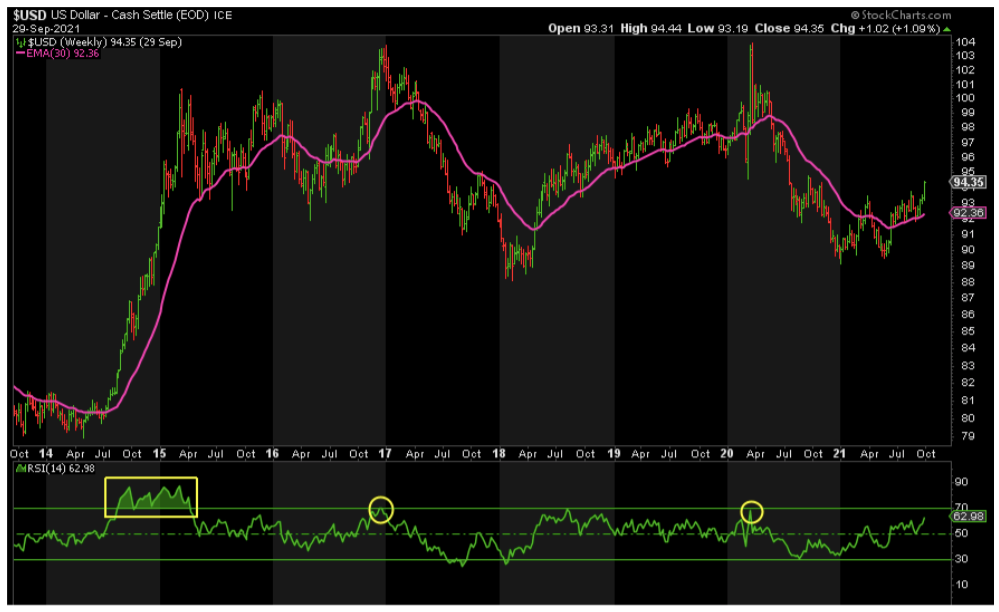
While the same can be said of the weekly chart, I would ideally like to see a weekly RSI of 70 to signal the peak is in.
Positioning data provided by Ole Hansen of Saxo Bank—the best indicator around of such positioning, imho—shows that Funds are racing to get long the dollar, which means the Banks are racing to get short. Typically, the Banks turn out to be right.
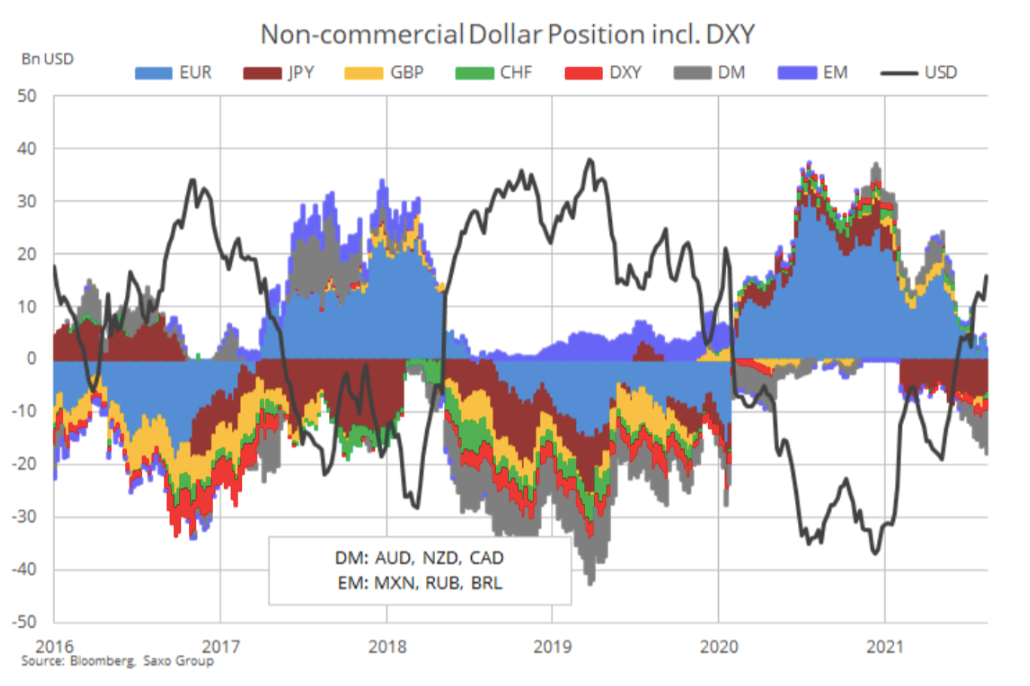
Funds’ net long against 10 IMM futures and the DXY jumped 39% to $15.8bn, a 21-month high. Although not there yet, positioning in the dollar is heading up towards peak levels seen in 2019 and 2017. This backs up what we’re seeing on the daily and weekly DXY charts.
Switching to Fibonacci levels, the DXY has surpassed the level where wave C = wave A in the ABC rally off the low of 89.17 in January 2021. The next target where wave C = 1.618 * wave A is at 96.50.
In summary, a negatively divergent higher high on multiple timeframes coupled with a peak in positioning should signal the peak in the dollar. Best guess is around 96.50. If the negative correlation to Gold continues, this will signal the bottom is in place.
BONDS
The negative correlation between real and nominal bond yields relative to Gold has been far less reliable recently. Although many focus on the nominal bond yield, it is the real yield (nominal bond yield less inflation rate expectations) that has a far more consistent negative correlation to Gold. That said, it too broke down recently. 10-Year Real Yield Courtesy of Quandl.com:
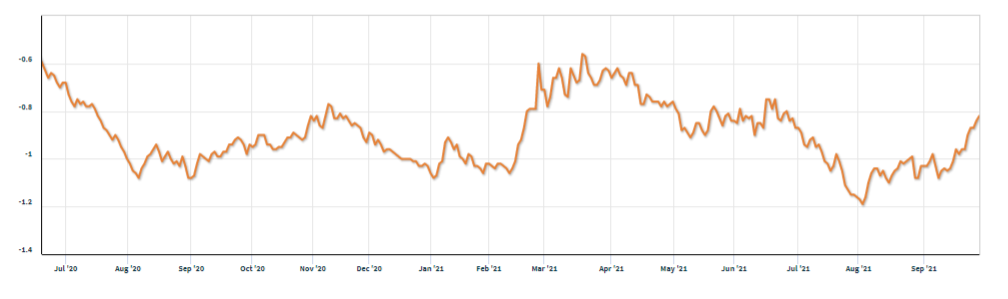
Despite the drop in real yields from June to a low of -1.19% in August, Gold continued to fall. The opposite typically occurs. Since that low, we’ve seen the real yield jump to -0.82% and Gold continues to fall. Further evidence of the power of Bullion Banks to suppress Gold prices, imho.
However, Gold and real yields tend to re-establish their correlation after periodic breakdowns such as this, as they did in 2018. With Gold following real yields again, the next time real yields peak and begin to fall, I expect Gold to rally hard.
Although nominal yields are less reliable, we can use them to gauge when they are going to peak and fall, which should signal the peak and fall in real yields also. The only caveat to this is a sharp drop in inflation expectations, which does not look likely any time soon.
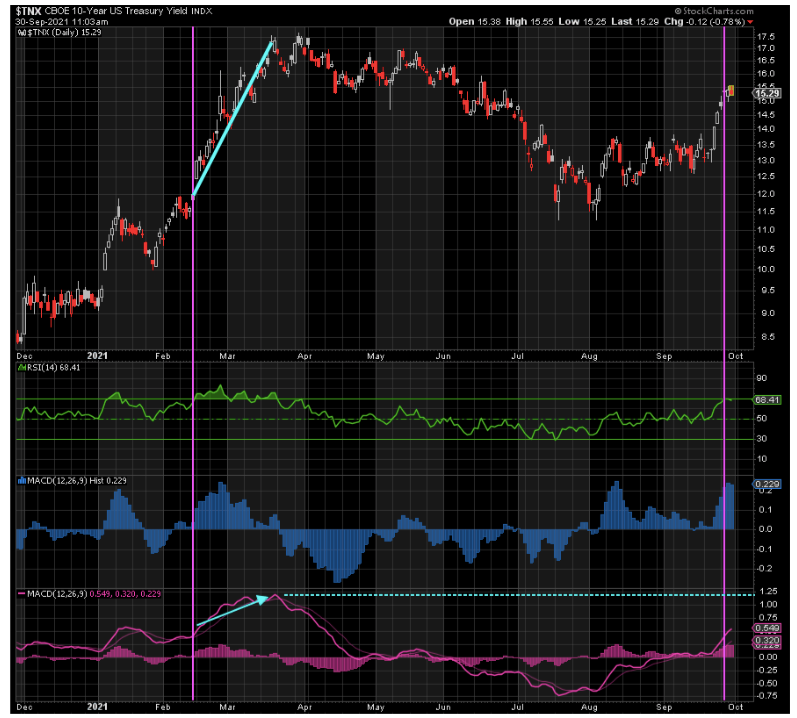
Although the 10Y yield is extreme overbought per the RSI, we saw back in February and March this year that it can become more overbought before it peaks. During that period, even though the RSI was over 70, the yield continued to rise from 1.20% to 1.75%, or 0.55%. The same thing could happen this time around, suggesting a peak around 2%.
It was the peak in the MACD Line that ultimately decided the peak in yields, and the current MACD level still has plenty of room to move up before hitting that same level or slightly lower for a negatively divergent higher high.
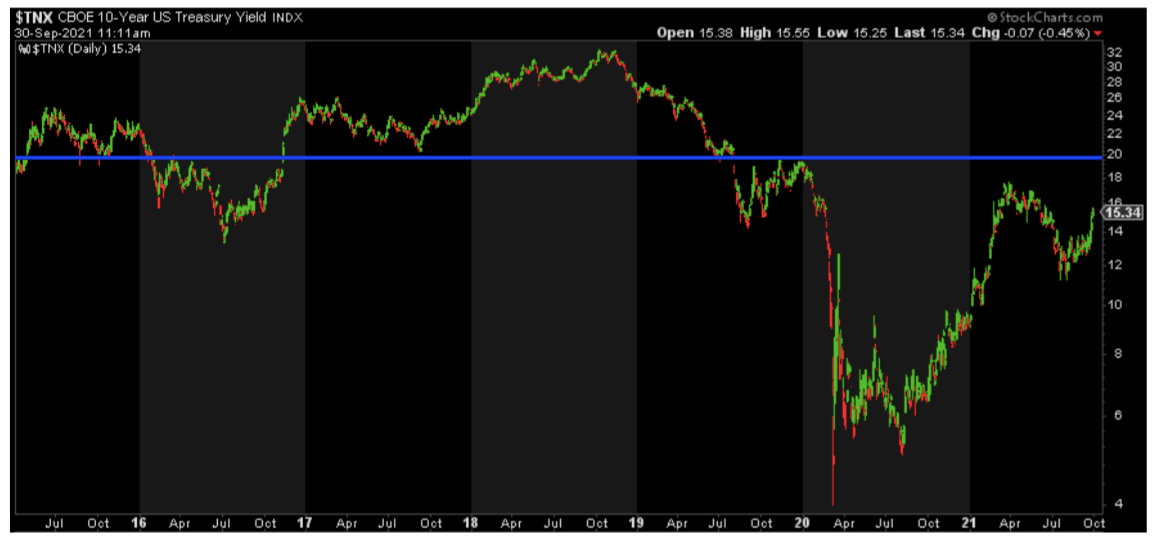
If we go back ~7 years on the daily chart, we also see that 2% is a key pivot level for the 10-Year:
Lastly, the weekly chart is displaying a clear set-up for a negatively divergent higher high in yields:
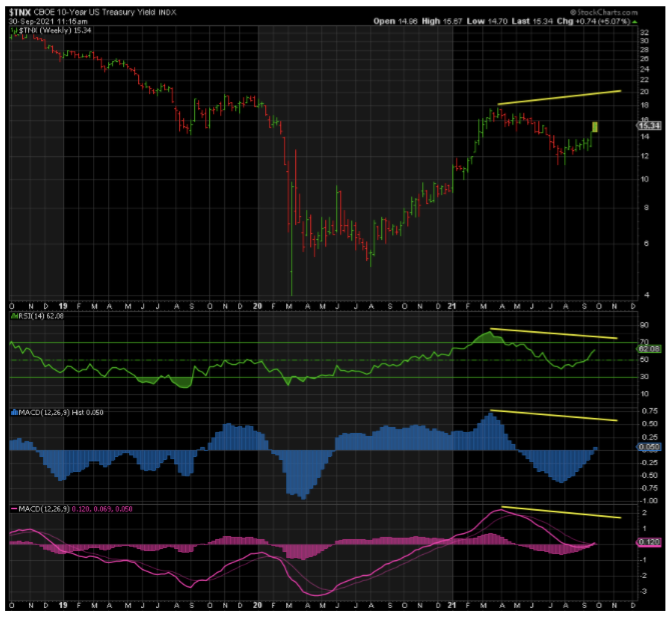
In summary, the 10-Year signals a negatively divergent higher high around 2% before turning down again. Given that the current level is ~1.53%, that means a possible 33% rise in yields, further increasing real yields and putting more downside pressure on Gold. That assumes of course that it doesn’t turn down before reaching the prior peak at 1.76% or inflation explodes higher.
SENTIMENT
The persistent drop in Gold since August 2020 has understandably demoralized traders and investors in this space, as it was designed to do. I am observing all of the emotions we typically see near lows: despondency, disappointment, anger, and most important of all, apathy. People are not just bearish; many have lost all interest in this space. They simply don’t care anymore. This is what I saw in the second half of 2015 when I began buying Gold. I saw something similar at 1124 in December 2016 and 1167 in August 2018. While sentiment doesn’t mark the exact point that price turns, it is an especially good indicator that the bottom (or top) is close. I am clearly seeing that now.
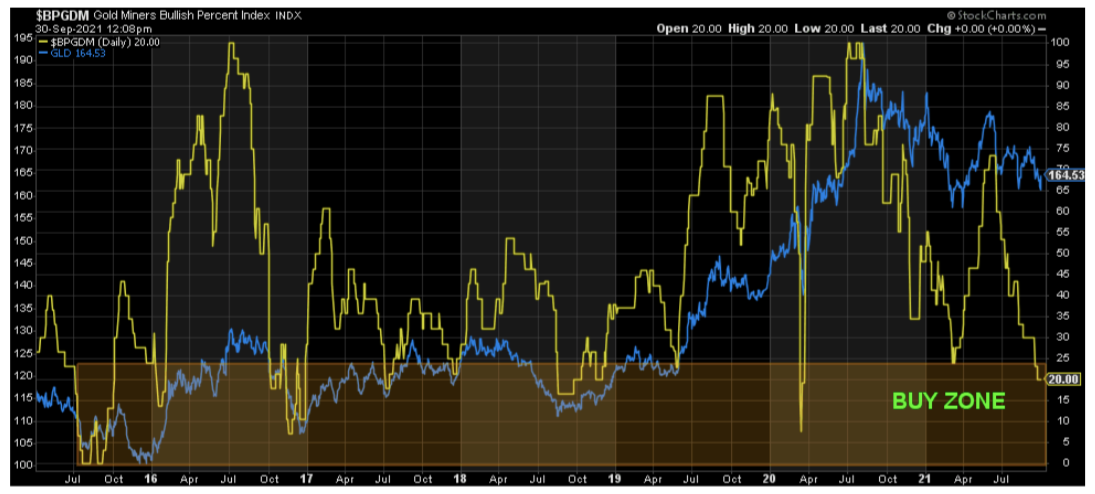
POSITIONING
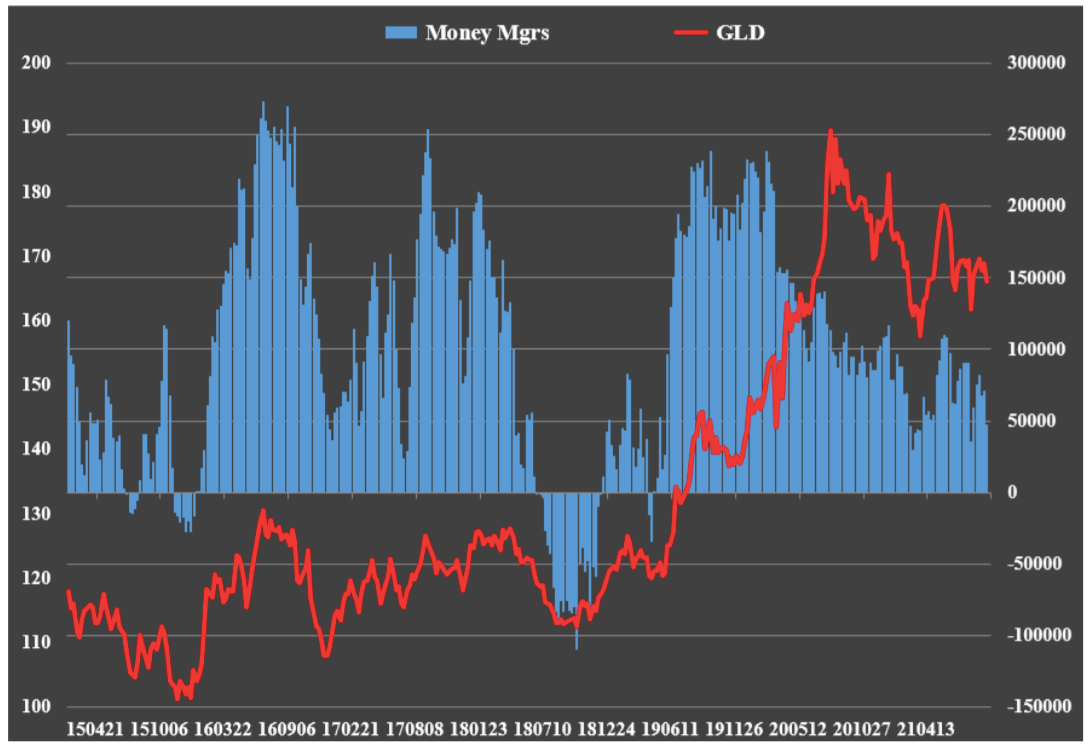
Funds cut their Gold longs at the fastest pace since August 10th and also have their lowest net long position since then. Same for the Commercials on the short side. Very encouraging but does not mean the bottom is in yet.
As for Silver, Funds now have their lowest net long position (1k only) since being short on June 11, 2019, when it was at $15. Commercials have their lowest net short position since that day too. This does NOT signal the low is in place, but it does say we're getting closer!
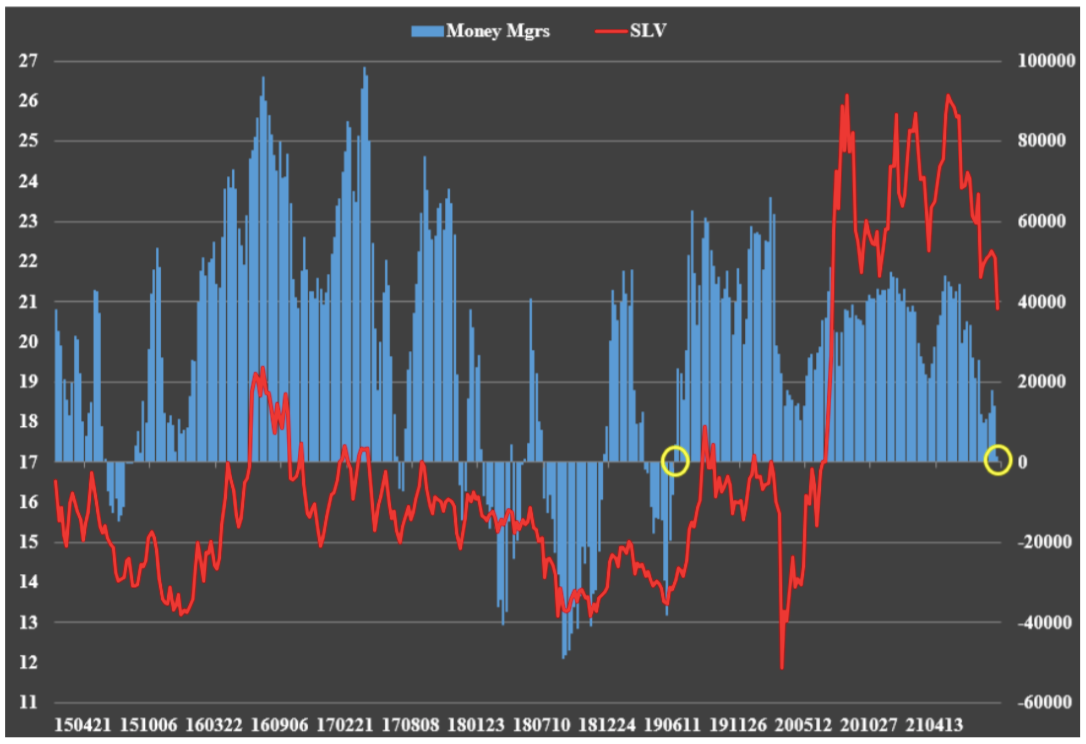
Positioning in the metals could improve even further if the Funds go short and the Commercials get long, just as they did in 2019, 2018, and 2015.
TECHNICAL ANALYSIS & FIBONACCI LEVELS
GOLD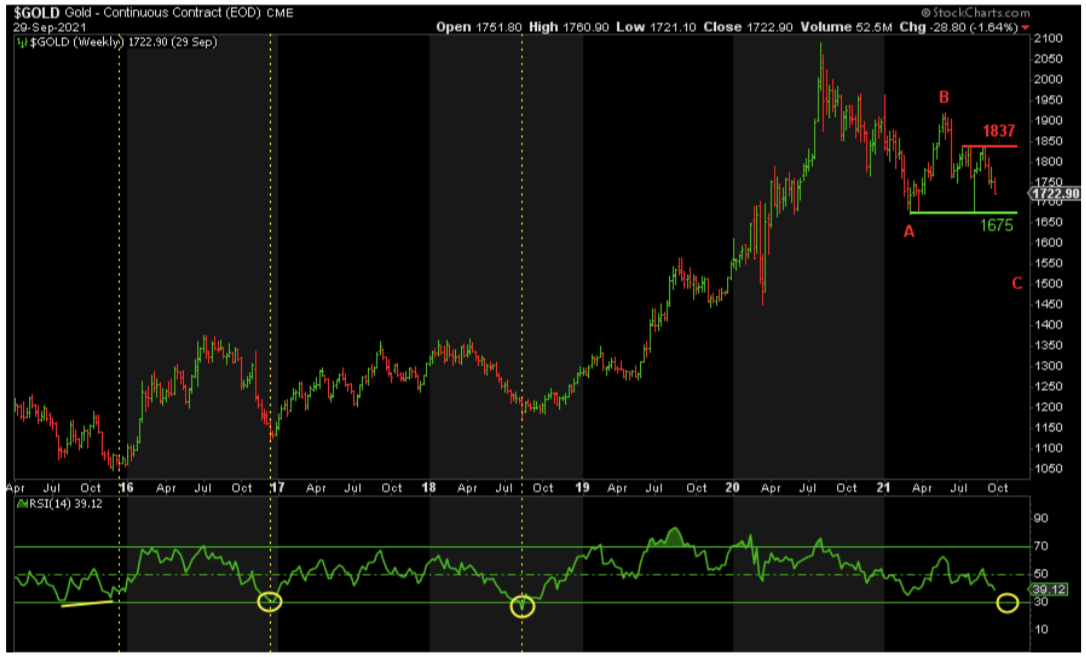
Nothing has changed for Gold in the past week. I’m still looking for a weekly RSI of 30 or a positively divergent lower low to signal the bottom is in. 1675 is the key support level and 1837 on the upside.
The ABC correction under way since the 2089 peak signals a move down as far as 1500 on a worst-case basis, where wave C = wave A in size. A break of 1675 increases the probability of such an outcome.
SILVER
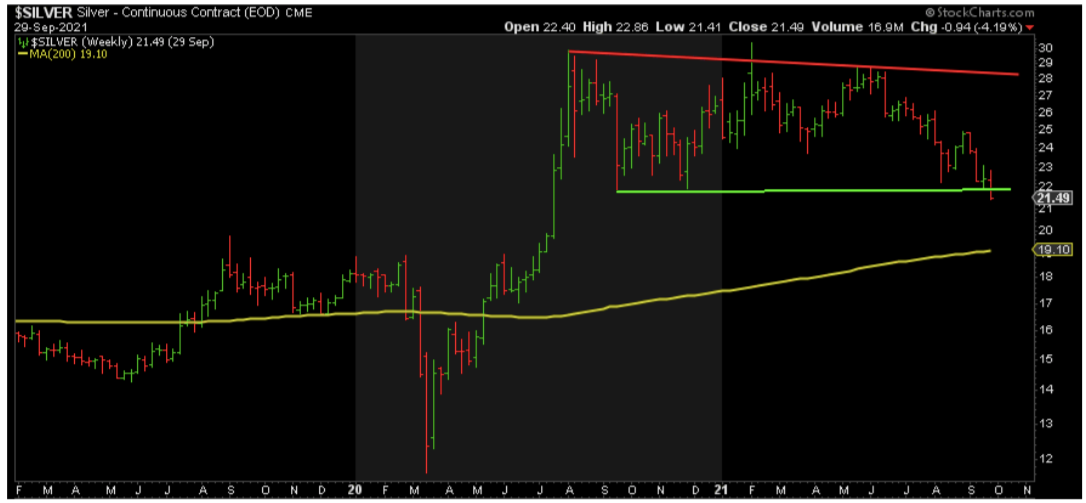
Silver has broken key support at 22 and taken out the stops below there. We are seeing a backtest of that support, now resistance, today. If we get back above there and 23.15, then the likelihood that the bottom is in increases.
However, if we fail, my worst-case target of 18, where wave C = 1.618*A, becomes a higher probability for the low and rally to follow.
GDX
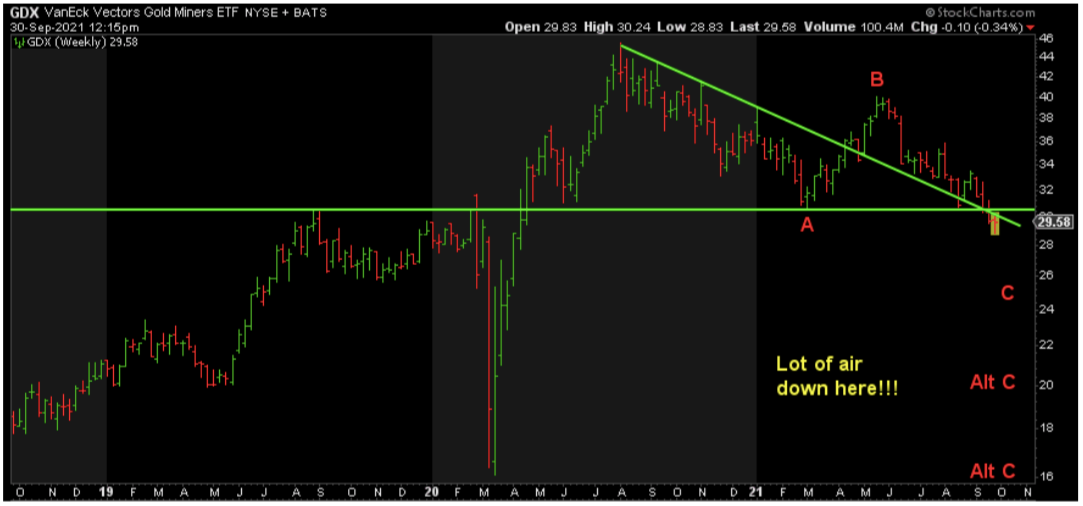
GDX has definitively broken down, as forecast. It is backtesting former support, now resistance at ~30-31. If it fails to break up through there, targets for the low on the downside are ~25, ~20, and absolute worst-case, 16, for a massive double bottom.
SILJ
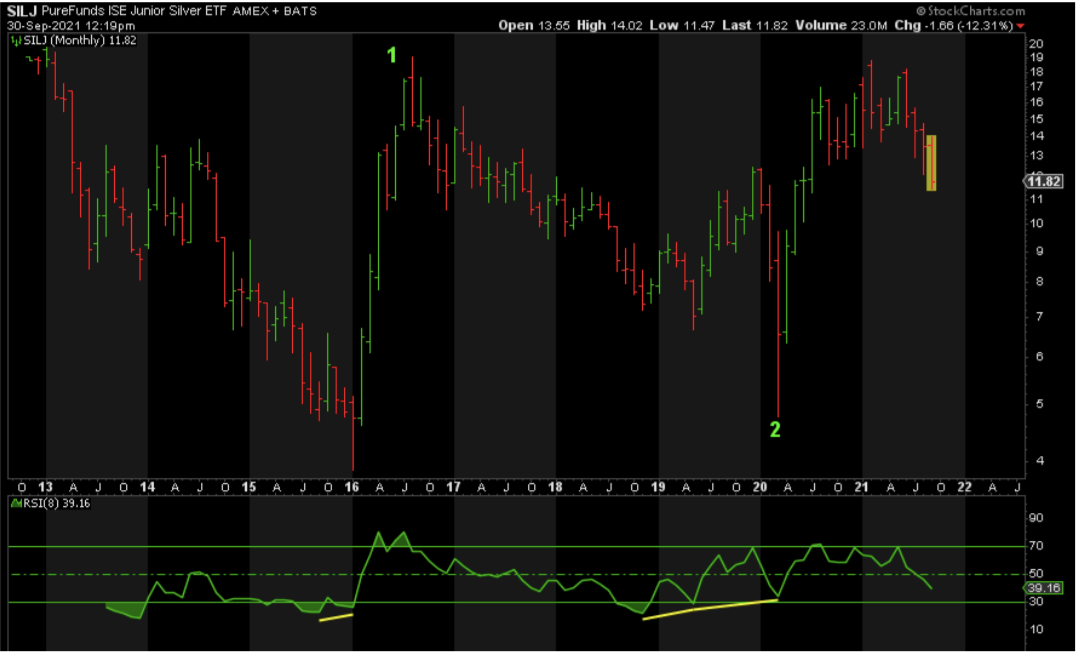
SILJ has broken down too and is making new lows not seen since July 2020. The monthly RSI indicates it’s not done yet. Support levels I am focusing on are 8.00 and 6.77 on the downside. It needs to break back above 12.40 to even suggest the bottom is in.
SILJ gets hit the hardest on the downside. Yet, it also appreciates the most when the turn up comes.
FUNDAMENTALS
Outside the sector itself and the dollar and bond yields, my primary focus is the S&P.
My targets on the downside remain 4225 at a minimum and 4080 maximum. The further stocks fall, the more likely we are going to see new stimulus and the less likely it is for a taper. This is the fundamental catalyst I am looking for to catapult precious metals and miners higher.
Please keep in mind that Gold bottomed in October 2008, six months ahead of QE1 in March 2009. Gold will likely anticipate the coming monetary and fiscal stimulus in advance.
CONCLUSION
While we remain patient for lower lows yet to come, everything is lining up for a truly massive rally:
- Peak in DXY, real and nominal yields
- Bottom in S&P
- Funds short, Commercials long precious metals
- Apathetic sentiment
- Extreme oversold and possibly positively divergent lower lows at key Fibonacci levels
- Massive monetary and fiscal stimulus ahead
- Final stage of Basel III is almost upon us: Jan 1, 2022
Don’t miss a golden opportunity.
Now that you’ve gained a deeper understanding about gold, it’s time to browse our selection of gold bars, coins, or exclusive Sprott Gold wafers.


About Sprott Money
Specializing in the sale of bullion, bullion storage and precious metals registered investments, there’s a reason Sprott Money is called “The Most Trusted Name in Precious Metals”.
Since 2008, our customers have trusted us to provide guidance, education, and superior customer service as we help build their holdings in precious metals—no matter the size of the portfolio. Chairman, Eric Sprott, and President, Larisa Sprott, are proud to head up one of the most well-known and reputable precious metal firms in North America. Learn more about Sprott Money.
Learn More
You Might Also Like:

Looks like there are no comments yet.