


Did you know you can get the Sprott Money Monthly Wrap Ups, Ask The Expert,
special promotions and insightful blog posts sent right to your inbox?
Sign up to the Sprott Money Newsletter here.
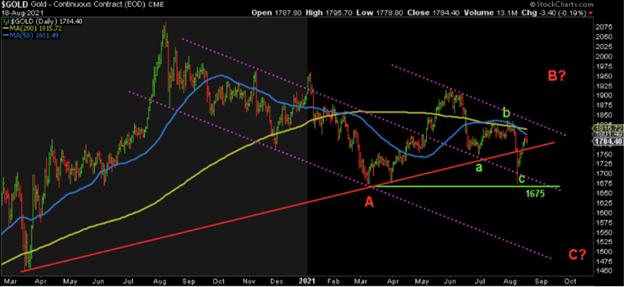
I first shared this chart in an article for Sprott Money back in July 2021. It shows a classic A-B-C correction where the size of wave C = A. The only unknown is the peak in B. Once we reach the bottom of C, the next rally begins.
This is what the chart looks like today, now that we know the peak in B:
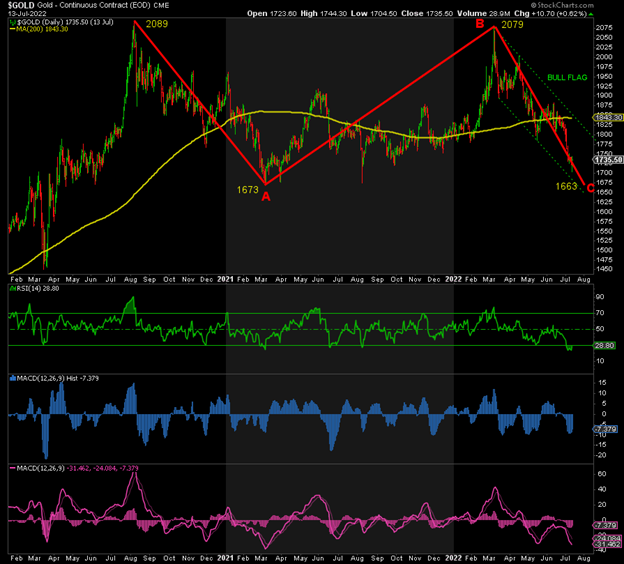
Wave A = 2089 – 1673, a drop of $416
Wave B = 1673 – 2079
Wave C = 2079 – 1663, also a drop of $416
The size of the drop in wave C is the same as that in wave A. Now, it is does not have to be perfect—Gold could fall to 1660, 1650, or even 1675 holds—but you get the picture.
Such ABC corrections typically complete when wave C = A, but it is not atypical to see wave C = 1.618*wave A. In such a scenario, wave C could fall as low as $673 (1.618*416) to 1405 before bottoming out. Given how bearish and oversold Gold already is, this is highly unlikely.
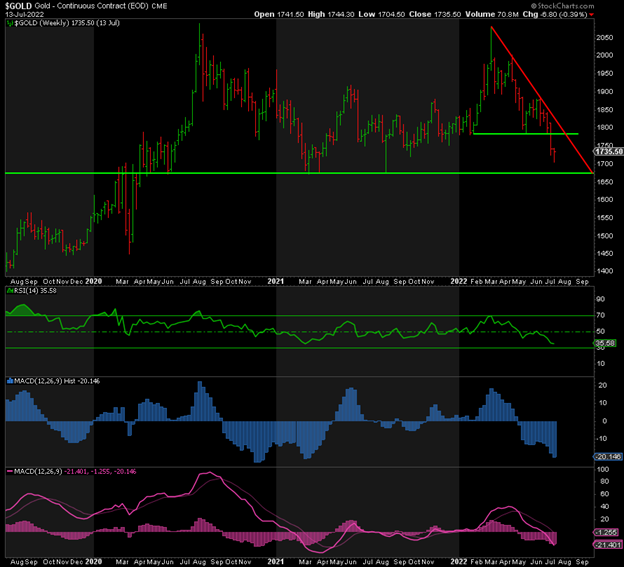
The weekly chart above shows that the RSI is lower than it was in March 2020. Think about that. The last time it was lower than this was at 1167 in August 2018. The MACDs are at their lowest levels since the bottom at 1673 in March 2021.
In summary, from a risk-reward profile, the technical data is signaling a massive skew to the upside in Gold relative to the downside risk.
The COT positioning data also shows the Banks slashing their shorts to levels not seen since June 2019 when Gold was in the 1300s. While they can continue to cut their shorts, pushing the price lower, their current positioning is bullish. The more they cut their shorts, the more bullish it becomes.
Sentiment is still relatively neutral in Gold but falling fast, imho. By contrast, sentiment has been crushed in Silver and the miners.
Simply stated, the data does not signal the bottom is in yet. We need a break of resistance and a series of higher highs and lows for that. But it does signal that the remaining downside is miniscule when compared to the potential upside.
When I look at my FIPEST xM process, this is what I see:
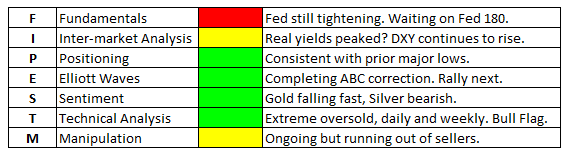
The beauty of this process is that it is time-tested, data-based, and uses multiple tools (rather than just one or two) to identify the lows. When they all point in the same direction, I’m all-in. Unfortunately, the Fed’s tightening policy and the activities of the Bullion Banks continue to push prices lower and delay the inevitable rally to come. Once the Fed does pivot, the Banks will get out of the way for fear of being run over. A break back above 1785 and a series of higher lows and higher highs would also suffice. Until then, we just have to grin and bear this correction for a little longer.
Don’t miss a golden opportunity.
Now that you’ve gained a deeper understanding about gold, it’s time to browse our selection of gold bars, coins, or exclusive Sprott Gold wafers.


About Sprott Money
Specializing in the sale of bullion, bullion storage and precious metals registered investments, there’s a reason Sprott Money is called “The Most Trusted Name in Precious Metals”.
Since 2008, our customers have trusted us to provide guidance, education, and superior customer service as we help build their holdings in precious metals—no matter the size of the portfolio. Chairman, Eric Sprott, and President, Larisa Sprott, are proud to head up one of the most well-known and reputable precious metal firms in North America. Learn more about Sprott Money.
Learn More
You Might Also Like:

Looks like there are no comments yet.