


Did you know you can get the Sprott Money Weekly Wrap Ups, Ask The Expert,
special promotions and insightful blog posts sent right to your inbox?
Sign up to the Sprott Money Newsletter here.
The 7.17% June decline in gold bullion1 was triggered by the "hawkish tilt" expressed at the June 15-16 Federal Open Market Committee (FOMC) meeting. Gold mining shares declined 12.64% during the month.2 We believe the smackdown was a temporary reaction to the perceived change in the Federal Reserve's (Fed) posture towards possible balance sheet reduction. In our opinion, the investment rationale for precious metals exposure remains unscathed.
In its June statement, the FOMC acknowledged the obvious, that they were behind the curve on recognizing that the post-COVID economic recovery had come sooner and stronger than they had expected. In belatedly admitting the obvious, the Fed knocked investment strategies positioned for inflationary outcomes for a loop. The implied threat that the Fed would act aggressively to curb inflation sooner rather than later was the entire gist of the change in messaging from previous FOMC statements. If the Fed's intent was to deflate frothy inflationary market expectations, count this shift as a success. However, Fed policy remains highly accommodative. The roots of inflation continue to gain political, economic, and social traction. The Fed, historically inept on matters of timing, will react too late. The constituency for sound money has all but vanished. The dollar debasement thesis remains on track as the subterranean glide path for real interest rates seems locked on autopilot.
Figure 1. Negative Real Interest Rates Drive Gold Higher
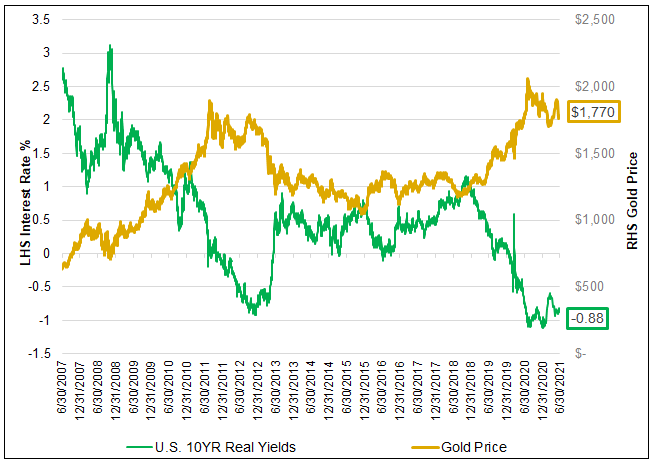
Source: Bloomberg. Data as of 06/30/2021. Real yields are measured by USGGT10Y Index, representing U.S. 10-year TIPs (Treasury Inflation Protected) yields. You cannot invest directly in an index. Past performance is not indicative of future results.
Gold and gold mining stocks are compelling buys. The vast majority of producing miners are generating free cash flow. Current strong earnings are geared to advance at a steep slope should our positive expectation for future gold prices prevail. Valuations, both relative and absolute, are the most attractive in two decades, as illustrated in the table below (compiled by my colleague Paul Wong).
Figure 2. Comparison of Gold Miners3 vs. S&P 5004
|
METRIC |
GOLD MINERS (GDM) |
S&P 500 |
GDM vs. S&P 500 |
|---|---|---|---|
|
EV/EBITDA |
6.86 |
18.36 |
GDM ~1/3 of valuation |
|
FREE CASH FLOW YIELD |
6.91 |
3.31 |
GDM +2x Free cash flow yield |
|
RETURN ON CAPITAL |
10.30 |
6.84 |
GDM +50% higher |
|
NET DEBT TO EBITDA |
0.13 |
1.30 |
GDM fraction of debt |
|
PROFIT MARGIN |
19.00 |
9.47 |
GDM +2x higher |
Source: Bloomberg. Data as of 6/30/2021. You cannot invest directly in an index. Past performance is not indicative of future results.
The June selling was almost entirely a knee-jerk synthetic affair driven by algorithmic, headline scanning robotic macro funds. The accumulation and investment in physical gold continues. On June 18, investors bought $630 million of 100% gold-backed GLD shares (SPDR Gold Shares ETF), the largest one-day inflow since January 15, 2021. Central banks bought $6.3 billion of the yellow metal during the second quarter (according to the World Gold Council). Virtually no physical gold was dumped in the rout. What was sold was almost exclusively futures or derivatives. Sales based on macroeconomic speculation require only sufficient balance sheet strength to satisfy counterparties that contracts can be cash settled. Flows in the physical and paper gold markets seem to be headed in opposite directions.
Is a wording tweak enough to derail inflationary forces, or are recent high CPI (consumer price index) readings the beginning of intransigent inflation and not the hoped for transitory variety? In our view, "transitory" is a fig leaf to buy time and ward off financial market concerns related to unprecedented Fed balance sheet expansion. The Fed's thesis that inflation will wither as the froth of post-COVID reopening activity simmers down seems like an attempt to manipulate markets through thought control.
"Central Banks do not manage risk, they disguise it." — Daniel Lacalle, Chief Economist and Investment Officer, Tressis Gestión
Inflation Likely to Prove Intransigent
In our view, inflation will likely prove to be intransigent. Rising wage rates are a key reason. Based on Bureau of Labor (BLS) data, the pace of wage inflation is 4.8%.5 Labor, which accounts for roughly 67% of U.S. GDP (gross domestic product), is ubiquitous. It is embedded in the cost structure of everything. Worker pay is sticky and will not decline because of small increases in interest rates. Even though the rate of change in labor costs may vary year to year, it has never declined absent an economic crisis. Producers and manufacturers must find a way to pass increased labor costs along in order to maintain profit margins and thus inflation spreads.
U.S. import prices climbed more than 11% for the year ended in May 2021 and U.S. exports rose 17.4% in the 12 months (according to BLS). As the reopening surge settles, headline-grabbing price increases in raw materials and intermediate goods are likely to retreat and quite possibly lead to negative year-over-year comparisons in 2022. However, noise-related volatility should not be mistaken for declining inflation.
The recently reported 14.9% year-over-year gain in median housing prices (Case-Shiller U.S. National Home Price NSA Index) captures inflation more accurately than "owner equivalent rent (OER)," a theoretical construct6 of the BLS, which carries a 24%7weighting in official CPI statistics. As shown in Figure 3, the process and formula for calculating OER seem much less credible than the direction of home prices. Higher home purchase prices translate into increased mortgage payments which are not transitory.
Figure 3. The Rather Complex Formula for Calculating OER6
The Stock Market is Overheated
Finally, the highly evident inflation in financial assets, tangible assets and collectibles are unmeasured by the CPI. The Buffet indicator8 is 45% higher than the market peak in 2000 and 90% higher than the 2007 market peak, as shown in Figure 4.
Figure 4. The Buffett Indicator is at an All-Time High
Total Stock Market Capitalization to GDP (2003-2021)
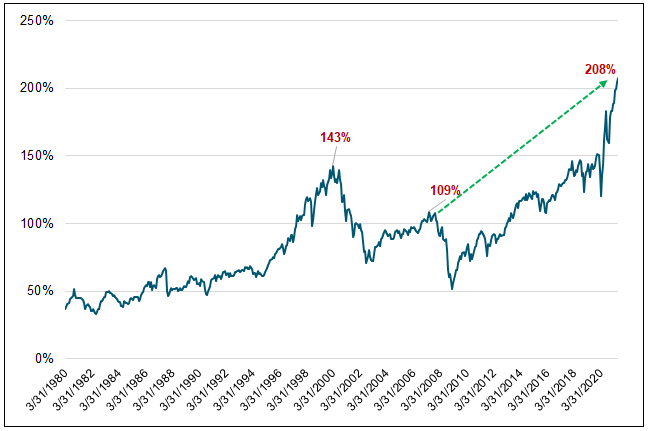
Source: Bloomberg. Data as of July 12, 2021. Total Stock Market Capitalization is measured by the FT Wilshire 5000 Index.9
Joseph C. Sternberg explained (The Wall Street Journal, "What Inflation Debates Miss: Inflation," February 11, 2021): "Inflation in the academic and policy jargon has come to mean a specific event: a rapid run-up in consumer prices." In Sternberg's view, the too narrow CPI goalposts do not capture the essence of inflation, including deeply entrenched social, political and psychological aspects. "Malfunctioning price signals [read: inflation] make it impossible for a society to allocate its resources with any rationality or fairness." Official government readings are blind to the "phenomenal bid-up in prices for financial assets," which "wreck the value of and income from" the savings of investors.
Gold's sell-off was based on fake fundamentals, a Fed concocted fantasy that a return to a tame 2% inflation rate will be easy. The reality is that inflation is off and running while the Fed remains positioned to stand aside. The Fed's belief that current high CPI readings will subside is based on hope, not sound analysis.
Slowdown in our Future?
The current level of economic activity is highly dependent on continued fiscal and monetary stimulus. As COVID pandemic-related support begins to decline, disappointing housing, retail sales and employment data show the economy is losing steam. There is ample reason to think that a slowdown could become a downturn in the absence of renewed fiscal support.
A small snippet from Rosenberg Research (July 7, 2021) paints the picture.
Let's assess the latest indicators:
- Aggregate hours worked were up just 0.2% these last three months.
- Auto sales were down 10.2% month-over-month in June after declining 8.5% in May. The twin 18 million+ unit sales in March and April to get ahead of the chip shortages borrowed a tremendous amount of buying activity from the future. The last time we came off such blowout levels in the summer of 2005, auto sales sank nearly 17% the following year (which then marked the end of the Fed's tightening cycle).
- Core retail sales came in at -0.4% in April and then -0.7% in May.
- Personal incomes fell 13.1% in April (fiscal stimulus withdrawal) then dropped 2.0% in May.
- New home sales were 7.8% in April then -5.9% in May.
- Real durable goods shipments were -0.6% in April and -0.4% in May.
- Construction spending fell 0.3% in May after a stagnant April. So I've covered consumer spending, CAPEX and housing. And the data show a sputtering economy as practically everyone focuses on lofty (though peaking) survey data.
The recent breakdown in bond yields (as shown in Figure 5) corroborates the view of economic weakness ahead.
Figure 5. U.S. 10-Year Treasury Yields (2020-2021)
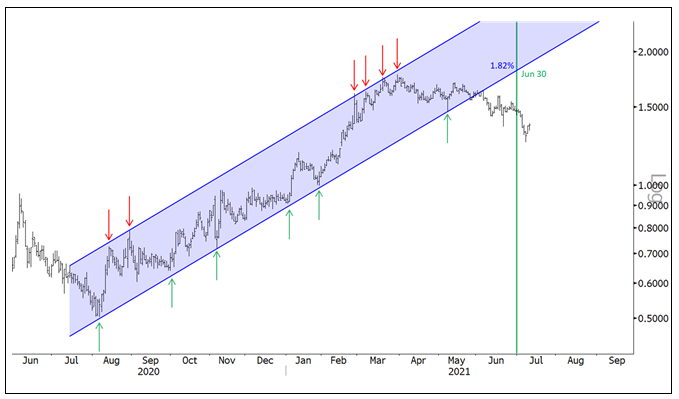
Source: Cornerstone Macro. Data as of July 12, 2021.
Without continued stimulus in the midst of rising food and energy costs, consumer spending could come under pressure. According to MacroMavens: "In the past 40 years, there have been nine such instances (when food and energy outlays outpaced wages) — only one of which failed to deliver an economic or financial downturn of real magnitude." (June 16, 2021)
Figure 6. Wages versus Food/Energy Outlays (1969-2021)
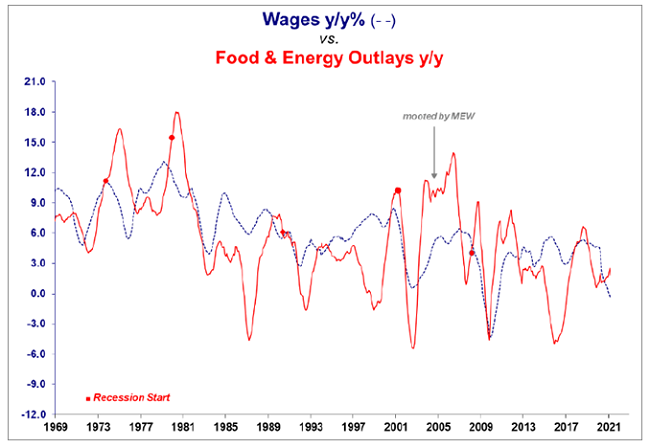
Source: MacroMavens. "MEW" is an acronym for mortgage equity withdrawals.
Our view is that a significant slowdown lies ahead. Should one materialize, calls for renewed fiscal and monetary support will not go unheeded. Fiscal stimulus and high deficits that require Fed balance sheet expansion are permanent. Chances that the economy can go cold turkey from incremental government support are minuscule, in our opinion. For this reason, inflation is likely here to stay.
Few market participants today experienced the coincidence of rising inflation and unemployment in the 1970s. As recounted by Fred Kalkstein: "From the mid-1970s to the early-1980s the unemployment rate increased from 5.1% to 10.8%. Yet during that period, the inflation rate increased from 6.3% to 13.0%. During that period when inflation was soaring, the economic indicators were flat, a phenomenon known as stagflation (per the Labor Department), and 10-year Treasury Bond rates soared up to 10.5%. The rates soared because they were behind what caused inflation, called the 'real rate.' Despite rising nominal rates, real interest rates (inflation-adjusted nominal rates) persisted at deeply negative levels. Gold and related mining stocks were top performers in the 1970s."
The rate of inflation has almost nothing to do with the level of unemployment, economic growth, or lack thereof. Inflation stems from monetary malpractice. The deflationist argument that high debt levels translate into persistent economic weakness and low inflation is very credible and is supported by ample historical evidence. We agree that high debt is an economic depressant but disagree that an economic slowdown in 2021-2022 would stop the inflation that has already taken hold.
The U.S. Debt Continues to Grow
Total public and private debt in the U.S. rose to 405.9% of GDP in 2020, up from 365.9% in 2019 as shown in Figure 7. Government debt alone increased 19% in 2020 to 127% of GDP. Over indebtedness acts as a drag on economic growth for three reasons: (1) ever greater requirements for debt service siphon off resources that could be invested in productive assets that could generate growth; (2) minuscule increases in interest rates threaten defaults to heavily leveraged entities, and therefore the yield curve can never be normalized absent a financial crisis; (3) it brings forward consumption into the present will not repeat in the future. For this reason, we think it is correct to project anemic GDP growth as far as the eye can see.
Figure 7. U.S. Private and Public Debt as a % of GDP (1870-2020)
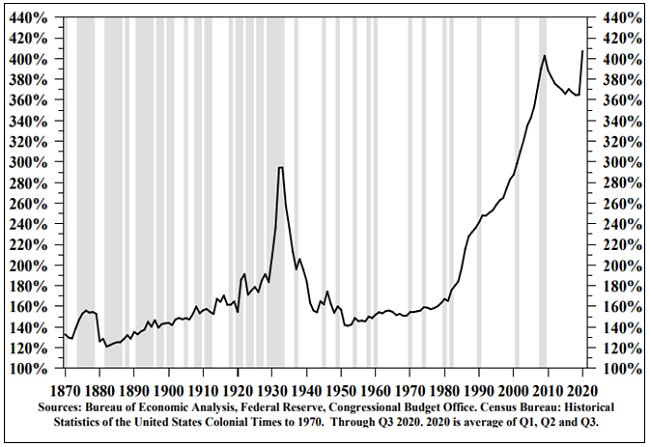
Source: Hoisington Investment Management Company, Quarterly Review and Outlook, Fourth Quarter 2020.
If overuse of debt depresses economic activity, then heaping on new layers of debt enlarges the problem. Japan is the most prominent example of this dynamic. In the absence of direct transmission of cash and credit into the hands of consumers and businesses by the central bank, excess liquidity created by government debt issuance remains trapped in financial institutions and is diverted into financial assets. This explains the long-term decline of monetary velocity to its current record low levels. More importantly, it also explains why financial asset valuations have surpassed all previous peaks.
Three counters to the view that a weak economy will stymie inflation are:
- Government spending now represents 22% of GDP, with government benefits accounting for 20% of total personal income. Government benefits are recession proof.
- Some Fed balance sheet expansion has already been transmitted directly into the economy through purchases of mortgage-backed securities. Policymakers will undoubtedly come up with new ways to do this.
- The technical distinction between Fed purchases of Treasury securities and direct injection of spending power into the economy by the Fed has been blurred by the back door of creeping benefits amounting to universal basic income.
Government stimulus has never created sustainable growth. Growth stems from the rational investment of private sector savings, in some cases accumulated following a prolonged period of austerity, which reduces dependence on debt. Examples include the austerity imposed by World War II and the draconian interest rates in the late 1970s and early 1980s. The multiplier on government outlays is negative. The top-heavy magnitude of public and private debt blocks the economy from outgrowing its debt burden in real terms and can only do so through inflation.
Faith in the Fed is Misplaced
Fed economic forecasts have been inaccurate over decades. It is astonishing to us that the investment consensus accepts Fed pronouncements, such as "inflation is transitory," as gospel. In our view, the expectation that the Fed can willfully reduce the size of its balance sheet fails the test of common sense. As noted by Joseph Sternberg (The Wall Street Journal, July 15, 2021), "Is There a Central Banker in the House?"), Fed Chair Powell is a "hostage to the market." He observed: "Financial markets exist to digest uncertainty. Policy makers' insistence on shielding investors from uncertainty about the course of policy, or anything else, has denatured markets.... It's yield-curve control by word of mouth."
Rhetoric aside, there seems to be little chance the Fed will raise a finger if only for the reason that it does not want to be scapegoated should an actual tightening topple financial markets. If the Fed were to do so, such a move would add to its long string of policy miscalculations, a possibility that is not out of the question.
Faith in the Fed's omniscience is convenient to the investment consensus because it underpins the extraordinary overvaluation of financial assets. Let’s face it, despite pious subservience to the goals of full employment and price stability, the Fed’s real mandate is to keep financial markets from coming unglued. The relationship between overvalued financial assets and belief in an all-knowing Fed is symbiotic. Loss of that faith for heavily sedated markets would lead to losses of trillions of dollars in the world of financial assets. That very real possibility is sufficient rationale for investment in gold and the expectation of much higher gold prices.
| 1 | Gold bullion is measured by the Bloomberg GOLDS Comdty Spot Price. |
| 2 | The Solactive Gold Miners Custom Factors Index (Index Ticker: SOLGMCFT) aims to track the performance of larger-sized gold mining companies whose stocks are listed on Canadian and major U.S. exchanges. |
| 3 | The NYSE Arca Gold Miners Index (GDM) is a modified market capitalization-weighted index comprised of publicly traded companies primarily involved in mining gold and silver in locations worldwide. |
| 4 | The S&P 500 or Standard & Poor's 500 Index is a market-capitalization-weighted index of the 500 largest U.S. publicly traded companies. |
| 5 | BLS Current Employment Statistics, 2021 vs. 2019. |
| 6 | Formula for calculating Owners' Equivalent Rent of Primary Residence (OER). |
| 7 | Source: Bloomberg CPIVOERR Index valued at 23.838% as of April 2021, the latest figure. |
| 8 | The stock market capitalization-to-GDP ratio is known as the Buffett Indicator and is used to determine whether an overall market is undervalued or overvalued compared to a historical average. |
| 9 | The FT Wilshire 5000 Index measures the performance of all U.S. equity securities with readily available price data. Approximately 5,000 capitalization-weighted security returns are used to adjust the index. |
Don’t miss a golden opportunity.
Now that you’ve gained a deeper understanding about gold, it’s time to browse our selection of gold bars, coins, or exclusive Sprott Gold wafers.


About Sprott Money
Specializing in the sale of bullion, bullion storage and precious metals registered investments, there’s a reason Sprott Money is called “The Most Trusted Name in Precious Metals”.
Since 2008, our customers have trusted us to provide guidance, education, and superior customer service as we help build their holdings in precious metals—no matter the size of the portfolio. Chairman, Eric Sprott, and President, Larisa Sprott, are proud to head up one of the most well-known and reputable precious metal firms in North America. Learn more about Sprott Money.
Learn More
You Might Also Like:

Looks like there are no comments yet.