


Did you know you can get the Sprott Money Monthly Wrap Ups, Ask The Expert,
special promotions and insightful blog posts sent right to your inbox?
Sign up to the Sprott Money Newsletter here.
GOLD
There are two primary scenarios in Gold right now:
- The bottom is in.
- This is a wave B bounce and we’re heading lower in wave C.
All have the same destination (up) but different routes.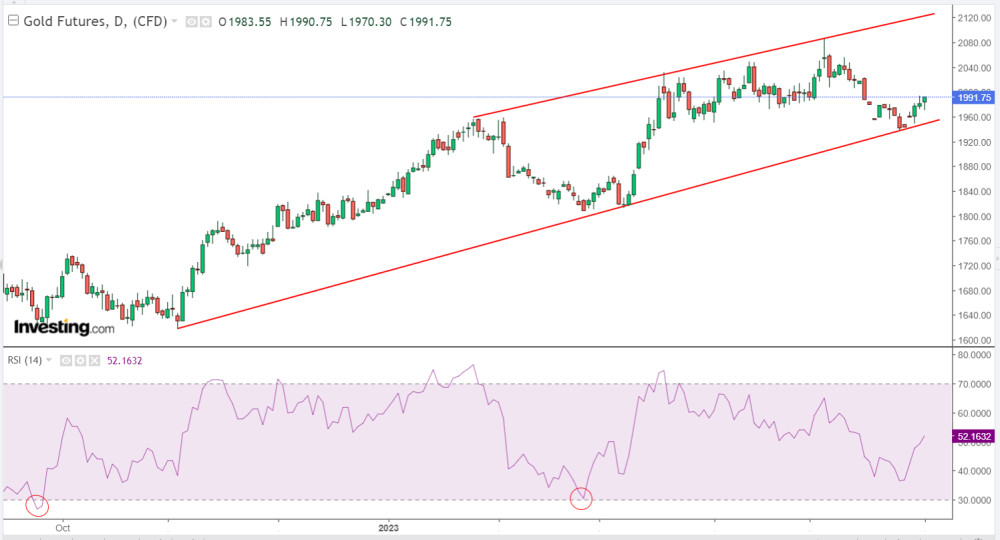
While Gold does not have to hit an extreme oversold RSI of 30 or below, it typically does when it bottoms. This makes scenario 1 a lower probability but still viable. Scenario 2 has a higher probability that we head down to an RSI of 30 or below once this bounce is over. A break of the support trendline would signal the second scenario is playing out, with confirmation below 1940. For now, Gold is testing resistance in the 1990-2000 range. I’m leaning to 60% in favor of lower lows and 40% that the bottom is in. Only a close above 2055 suggests the bottom is in.
There are three primary scenarios in the rest of the sector:
- The bottom is in.
- This is a short-term bounce and we’re heading down to a positively divergent lower low next.
- This is a wave B bounce and we’re heading much lower in wave C.
SILVER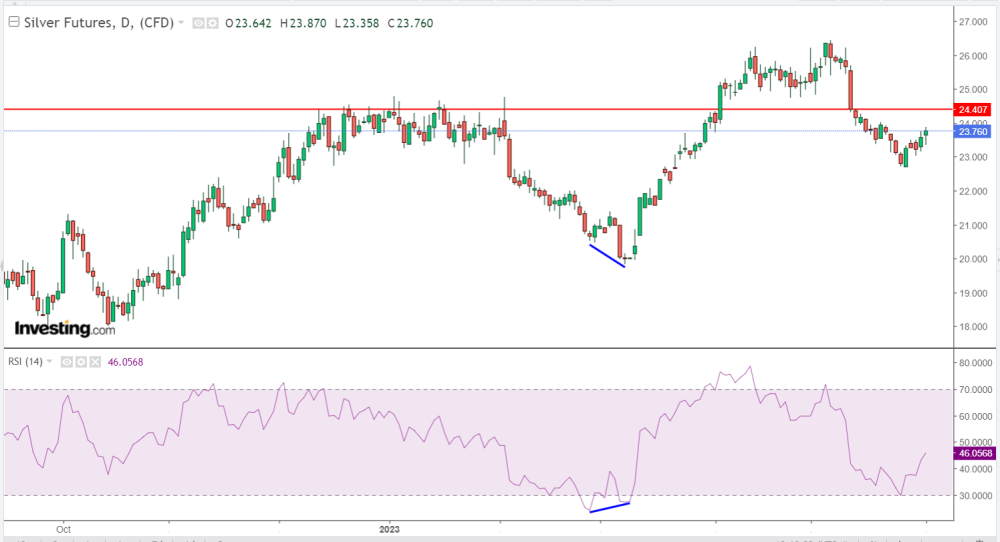
Silver tagged 30 in the RSI and now we’ve got a bounce. Could the bottom be in place? Sure, but it has to take out resistance at 24.40 before even suggesting that.
By contrast, if history repeats, we could get a positively divergent lower low in price, below 22.70, and a higher RSI, signaling the bottom is in. This is what happened in early March this year.
The worst-case scenario is that when this bounce peaks, we get a bigger drop in the next wave down that “at least” matches the size of the drop from the peak of 26.43 to 22.70, a decline of $3.73.
For example, if we bounce to 24.40 and resistance holds, Silver could fall to 20.67 or lower before the bottom is in place. A break of 22.70 would increase the probability of this scenario significantly.
Simply put, a break of 24.40 increases the probability that we’ve seen the low at 22.70. Only a break above 26.43 confirms it.
A break below 22.70 but with an RSI greater than 30, followed by a higher high above whatever the peak of this bounce turns out to be, would signal the low is in.
But if we fail to break 24.40 and break 22.70 instead, and the RSI is <30, then a ~20 handle in Silver is the minimum target.
GDX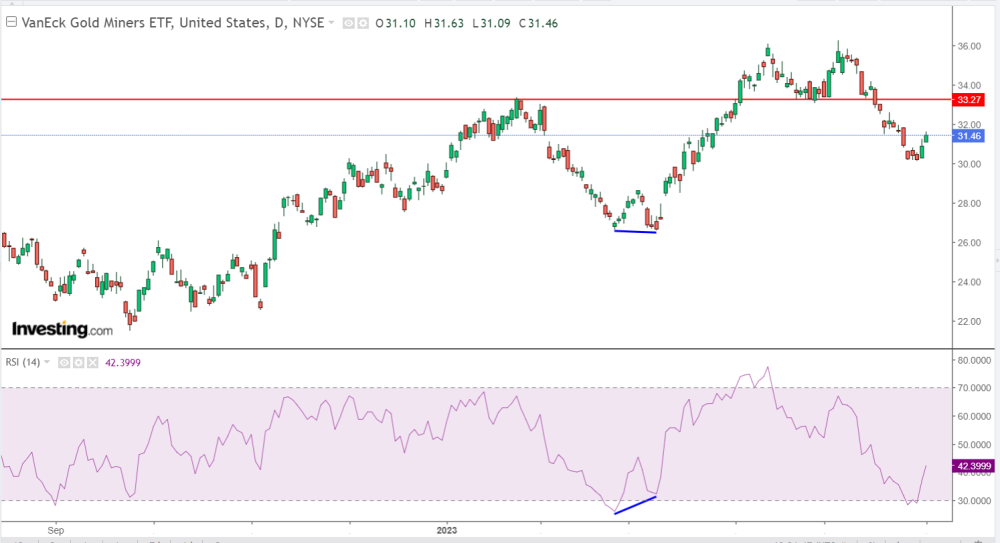
Unsurprisingly, the same scenarios for Silver apply to GDX.
There is a clear set-up for a positively divergent lower low in price and a higher RSI, 30 or greater, below $30.
On the contrary, if we break ~33.30, the probability of the low already being in place increases. Only a break of the peak at 36.26 confirms it.
The worst-case scenario is that we fail at 33.30 and fall in wave C to a ~27 handle. This would also close the gap left behind on the chart at 28 in the process. A break below $30 with an RSI less than would significantly increase this probability.
SILJ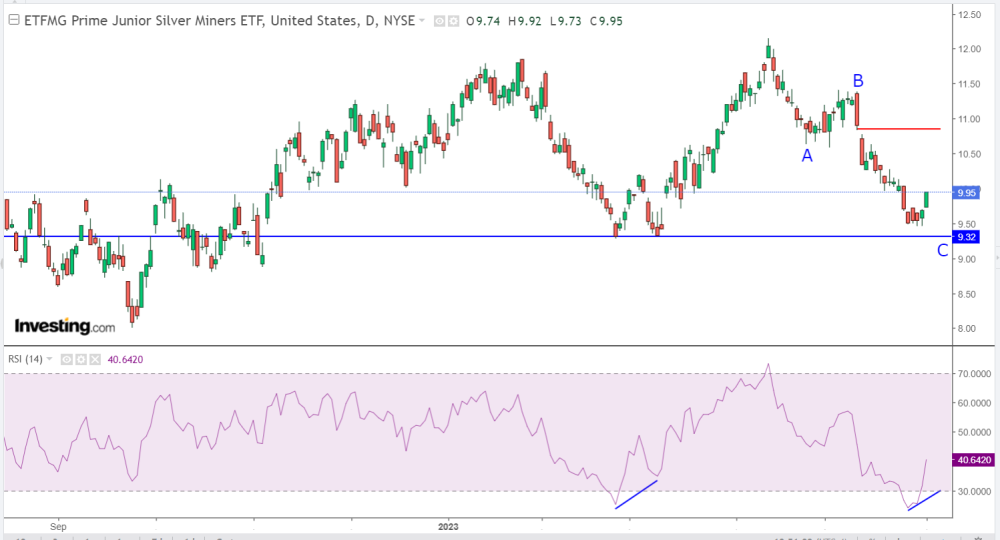
Saving the best for last. Despite its volatility, I find that SILJ is one of the easiest assets to chart. You can clearly see a wave A down, a wave B bounce, and we’re in wave C now.
There is a clear set-up for a triple bottom at ~9.30 and a positively divergent one too, similar to that in March this year.
However, the alternative is that wave “c” ended at ~9.50 and this is just wave c of A, with the wave B bounce under way, followed by a big wave C down to even lower lows, around $8.
Closing above the gap at 10.84, followed by a break of the prior high of 11.40, would favor the bottom is in and we’re going to take out the prior peak at ~12 next.
A positively divergent wave v of C down to a lower low for a triple bottom at 9.30 would also suggest the bottom is in.
But the worst-case scenario is that we get a sizeable bounce to 10 or 11, then head down towards 8 for a big double bottom there.
CONCLUSION
While that may be somewhat confusing to some, allow me to clarify all of this in simple terms: The risk to the downside in precious metals and miners is far, far lower than the potential reward to the upside.
Even if Gold were to fall to the low 1800s next, a drop of ~$160-180 from current levels, my minimum target on the upside is $2600, $600 higher.
A better example is SILJ. It could fall to $8, but my minimum target to the upside is $30. So, from current levels, we’re talking about a $2 drop, or a 20% decline, compared to a $20 gain, or upside of 200%. I like those odds.
On a final note, please keep in mind that such reversals in the metals and miners are designed to squeeze out the weak holders, to get as many people as possible to throw in the towel, before Gold and the rest take off to the stars. I’ve seen it many times: Mar - Oct 2022; Aug 2020 - Mar 2021; Mar 2020; Apr – Aug 2018; Jul – Dec 2016.
It’s all about probabilities and risk versus reward, and the need to control your emotions and fight human nature. In essence, at the risk of stating the blatantly obvious: buy low, sell high. The only risk to the pending rally is a 2008 or 2020 type event, but even then, in retrospect, they were fantastic opportunities to buy.
Don’t miss a golden opportunity.
Now that you’ve gained a deeper understanding about gold, it’s time to browse our selection of gold bars, coins, or exclusive Sprott Gold wafers.


About Sprott Money
Specializing in the sale of bullion, bullion storage and precious metals registered investments, there’s a reason Sprott Money is called “The Most Trusted Name in Precious Metals”.
Since 2008, our customers have trusted us to provide guidance, education, and superior customer service as we help build their holdings in precious metals—no matter the size of the portfolio. Chairman, Eric Sprott, and President, Larisa Sprott, are proud to head up one of the most well-known and reputable precious metal firms in North America. Learn more about Sprott Money.
Learn More
You Might Also Like:

Looks like there are no comments yet.