The Time Has Come Again for Junior Mining Companies
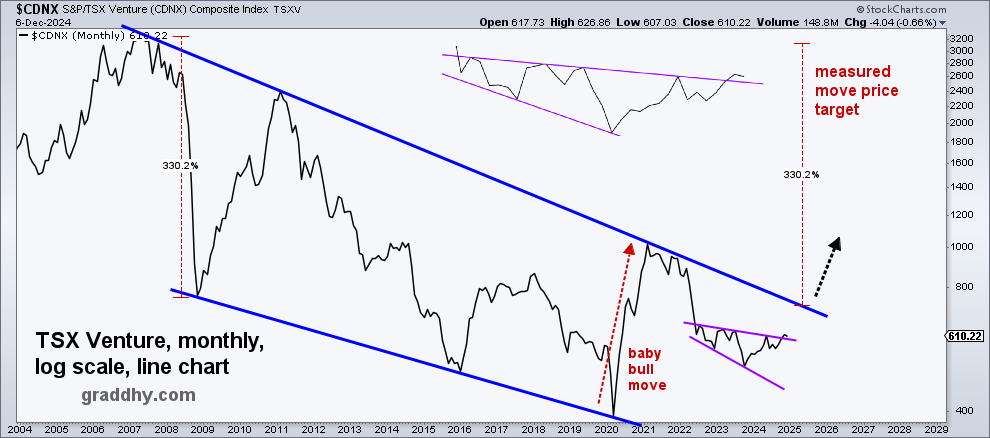
The S&P/TSX Venture Composite Index climbed 236.8% in its baby bull move up from the commodities bear market low back in 2020. This huge baby bull move lasted 11 months and kick-started a new secular bull market. Then this index for the TSX Venture Exchange spent about three years declining, which was needed in order to digest the strong baby bull move up.
Now it looks like the index is ready to start the next upleg for the bull market. During the baby bull, many junior gold and silver companies went up 500% - 1000%, and we should see that once again.
Technical Analysis – Bigger Picture Review
This will be a straightforward bigger picture review, using technical analysis and focusing mainly on trend, support and resistance plus patterns. Keeping the technicals as well as the language simple will hopefully make the message clearer. And by using inter-time frame analysis, the present setup should become more obvious.
At Resistance After Breakouts – Daily Chart
Starting with the daily time frame for the TSX Venture, it has a stylish setup with a breakout from an orange bull flag. And the orange bull flag pattern is backtesting the necklines of not only one but two inverse head and shoulder patterns: blue and pink necklines. After the orange bull flag breakout, price went straight up to the black 624 resistance level and got strongly rejected. This was expected since it was only the third attempt to break above that black 624 resistance level.
However, since an important resistance level is often taken out on the fourth breakout attempt, the next time price comes up to the black 624 resistance level, a breakout is likely. And if not on the fourth attempt, most probably on the fifth attempt.

TSXV Daily
Major Trend Reversal & Larger Breakout – Weekly Chart
Also, the weekly time frame has a stylish setup, with a recent breakout from a large 2.5-year purple expanding falling wedge. Note that the orange bull flag backtesting the head and shoulders´ necklines on the daily chart above is also the backtest pattern to the purple expanding falling wedge on the weekly chart. And the two inverse head and shoulder patterns on the daily chart above are what generated the energy for the purple expanding falling wedge to break out.
The upper line for the purple expanding falling wedge has now changed from being resistance into being support. A breakout above the black resistance line on the daily chart would signal that price is breaking away from the support line of the weekly purple falling wedge.
The weekly chart also looks to have a pink rounded bottom/arc in the making, which means price is likely to climb up the right side of the pink rounded bottom/arc in reverse symmetry style versus the left side, where it went down.
And that very-likely pink rounded bottom/arc move up could be strong judging by the large red volume thin zone. A volume thin zone is a previous price range where very little volume was traded and therefore holds very little resistance. Price should most likely move swiftly inside that red volume thin zone.
An expanding falling wedge is a reversal pattern, i.e., the breakout from the purple expanding falling wedge has reversed the direction of the larger trend to the upside. Furthermore, since the breakout from the purple expanding falling wedge surpassed the May 2024 high of 623.85, reaching 627.31 in October 2024, that means the weekly chart has reversed the trend also in the sense that it now has both a higher low and a higher high.

TSXV Weekly
Very Large Bullish Pattern – Monthly Chart
On the monthly chart, the aforementioned 11 months baby bull move, plus the nearly three-year decline that followed, stands out. What also stands out is the 17-year blue falling wedge, which will drive a massive move for the TSX Venture. And for the monthly chart, a line chart is used because it often shows breakouts earlier than a candlestick chart (so also this time). The zoomed-in version on the chart shows a perfect purple expanding falling wedge with a very clear breakout.
And note that the reverse symmetry move up the right side of the pink rounded bottom on the weekly chart above should make it break out above the massive 17-year blue falling wedge on the monthly. Moreover, the price target for the blue falling wedge is up at the all-time highs (measured from a probable breakout point).

TSXV Monthly
Supporting Ratio Chart
The index also needs to outperform the underlying asset for a real bull market to develop. Think here, e.g., the gold miners ETF SGDJ versus the price of gold. For the TSX Venture, the most relevant underlying asset is a broad commodities index. And that is what we have below: a very big picture ratio chart showing the TSX Venture versus a broad commodities index.
And what a chart it is. A 22-year falling wedge with a false breakout already done. Plus, after the move back inside the falling wedge, it made a higher high, which means the false breakout is confirmed, i.e., no need to go there again. And all of this means that this chart now finally looks ready to go for the big breakout shown by the arrow.
Note that the ratio chart also shows how historically undervalued junior commodities companies are versus the underlying commodities, and that screams potential.

TSXV vs CRB
What Would Drive Such a Massive Move?
The coming large and sustained move described above needs a main driver. And that driver will probably be the U.S. Dollar rolling over again and having a very large, extended decline. I plan to go over this and much more in coming articles.
Precious Metals Will be the Big Winner
The S&P TSX Venture Composite Index moving hugely means the precious metals sector will also move hugely, and it often leads the commodities sector. A second bull market leg up for this index also means that the second inflationary wave is about to hit.
For many reasons, it is very important to utilize this particular precious metal bull market. And only the right strategy, knowledge, stamina, and guidance will take you through what is coming. Physical gold and silver will be absolutely vital to have as insurance, since it is the only real money there is. It will protect you from further currency debasement and the huge inflation coming. In addition, platinum and palladium could be looked at for speculation, since their long-term charts look more than good too. Sprott Money is extremely well positioned here with the right experience, products, services, and knowledge.
Do make the most out of this glorious commodities bull market opportunity that started back in 2020.
And obviously, should price clearly break back below the upper line of the weekly/monthly purple expanding falling wedge, and with that negate the purple breakout, the bullish pattern setup could fail or be morphing.
Take Action Now. Buy Gold and Silver
Buy gold and buy silver online to protect your wealth and capitalize on the commodities bull market.
Don’t miss a golden opportunity.
Now that you’ve gained a deeper understanding about gold, it’s time to browse our selection of gold bars, coins, or exclusive Sprott Gold wafers.
About Sprott Money
Specializing in the sale of bullion, bullion storage and precious metals registered investments, there’s a reason Sprott Money is called “The Most Trusted Name in Precious Metals”.
Since 2008, our customers have trusted us to provide guidance, education, and superior customer service as we help build their holdings in precious metals—no matter the size of the portfolio. Chairman, Eric Sprott, and President, Larisa Sprott, are proud to head up one of the most well-known and reputable precious metal firms in North America. Learn more about Sprott Money.
Learn More
You Might Also Like:


Share: