


Did you know you can get the Sprott Money Monthly Wrap Ups, Ask The Expert,
special promotions and insightful blog posts sent right to your inbox?
Sign up to the Sprott Money Newsletter here.
Let’s get straight to it. Today, I focus on the key levels to watch on the downside for a possible bottom, including the worst-case scenarios, imho, plus the resistance levels on the upside to signal that perhaps the tide has turned. At the end of the day, Gold just closed at 2055 “twice”, following 2043 in March 2022 and the record closing high of 2069 in August 2020. The intraday peak was 2089 in August 2020 also. If we close above 2055 and take out 2089 on an intraday basis, it’s game on for new record highs, Silver to 50-60, GDX too, and SILJ in the 30s. I consider this inevitable. We’re going to break it on the third attempt, imho. In the meantime, let’s look at the support and resistance levels in the short-term, both from a technical and Fibonacci perspective, and focus on signals of confluence, i.e., where Fibonacci levels match technical levels—very powerful!
GOLD
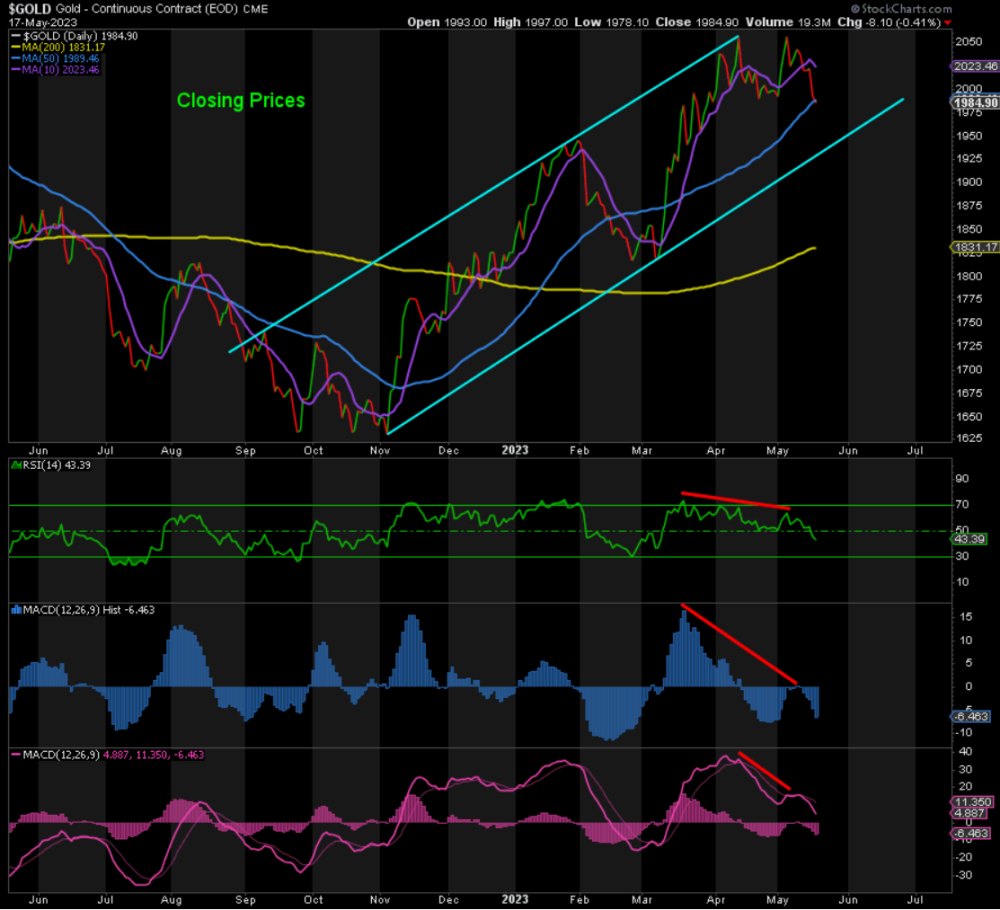
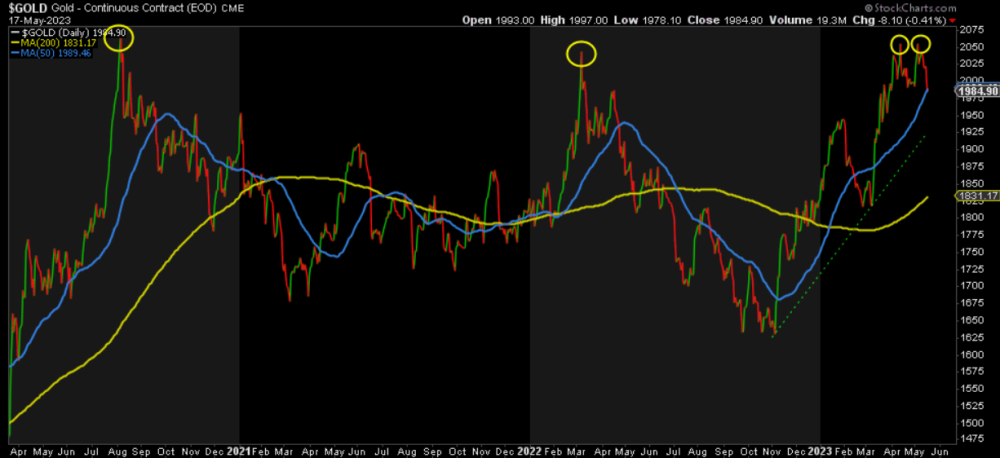
Resistance levels are easy. We need to close above the 10-DMA at ~2023. As stated, more important is 2055.
Support is at 1930-35, the bottom of the channel at 1930-35 and rising. If we get through that, then we could fall all the way down to the 200-DMA, currently at 1830.
Now for the Fibonacci retracement levels. Using the closing low of 1631 on Nov 3 and the peak of 2055, the Fibonacci levels are as follows:
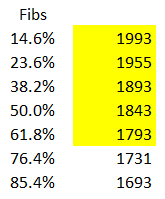
1955 is the 23.6% retracement. It just so happens that 1950 is also where wave C = 1.618*wave A in size, the other standard A-B-C correction. This is a strong support area. If the bottom of the channel rises to 1950-55 before Gold tests it, then it becomes a critical support level. In other words, if that’s broken, it could be a “look out below” moment. Lastly, we have 1843, the 50% retracement level, which the 200-DMA is approaching. If that is broken too, then stop out and wait for a break back above 1850. In summary, 1990, 1950-55, and 1843 are the key support levels. Keep an eye on 1893 too because a 38.2% retracement is a standard correction for a wave 2.
However, if Gold climbs back above 2000, that could be the first sign that the bottom is in.
SILVER
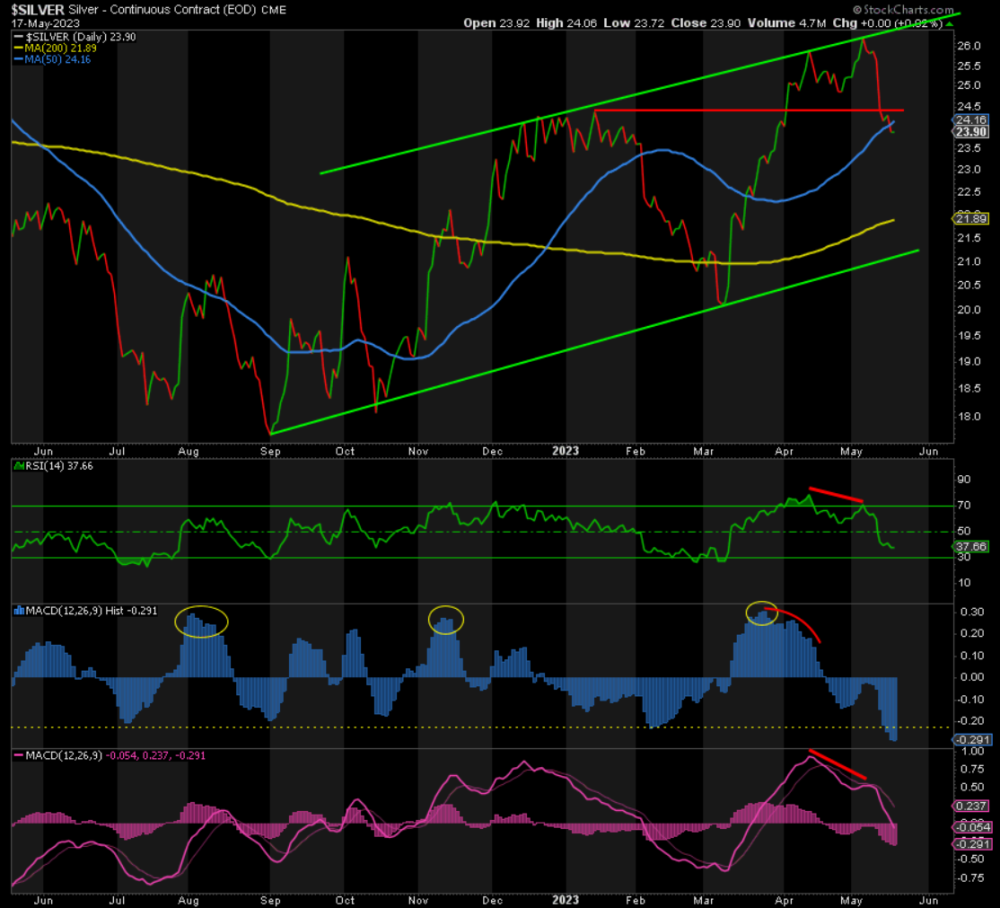
As expected, and almost always, Silver finally did succumb to multiple negative divergences. It has already broken support at 24.30, 24, and the 50-DMA. The RSI is approaching extreme oversold levels. The MACD Histogram is at its lowest level since May 2022. However, it didn’t bottom back then. The low occurred when a second positively divergent lower low occurred on Sept 1. The same could happen this time around too, meaning still-lower prices ahead.
The next technical support level is the 200-DMA, currently at 21.89 and climbing. Then it’s the bottom of the channel at ~21.20.
Switching to Fibonacci…
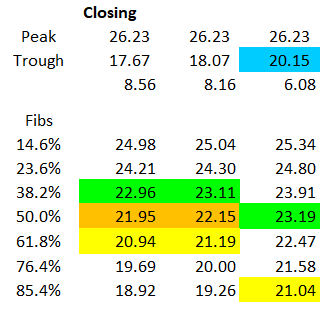
Observing the Fibs between the peak at 26.23 and the three prior lows, we get some areas of confluence. Having broken the 50-DMA, Silver closed at 23.90, the 38.2% Fib from the low of 20.15. Next we have a confluence of support around 23-23.20 (green numbers). Next is ~22 (orange) and the 200-DMA is approaching this level. This is a huge level. Last but not least is ~21.10 (yellow), which matches where the bottom of the channel is currently. In summary, support is at ~23.90, 23-23.20, 22, and 21.10. My preference is either 23-23.20 or ~22, based on the RSI and the MACD Histogram. Resistance is at 24.40 and the peak of 26.23. A break of 24.40 would offer the first tentative signal that the bottom is in.
GDX
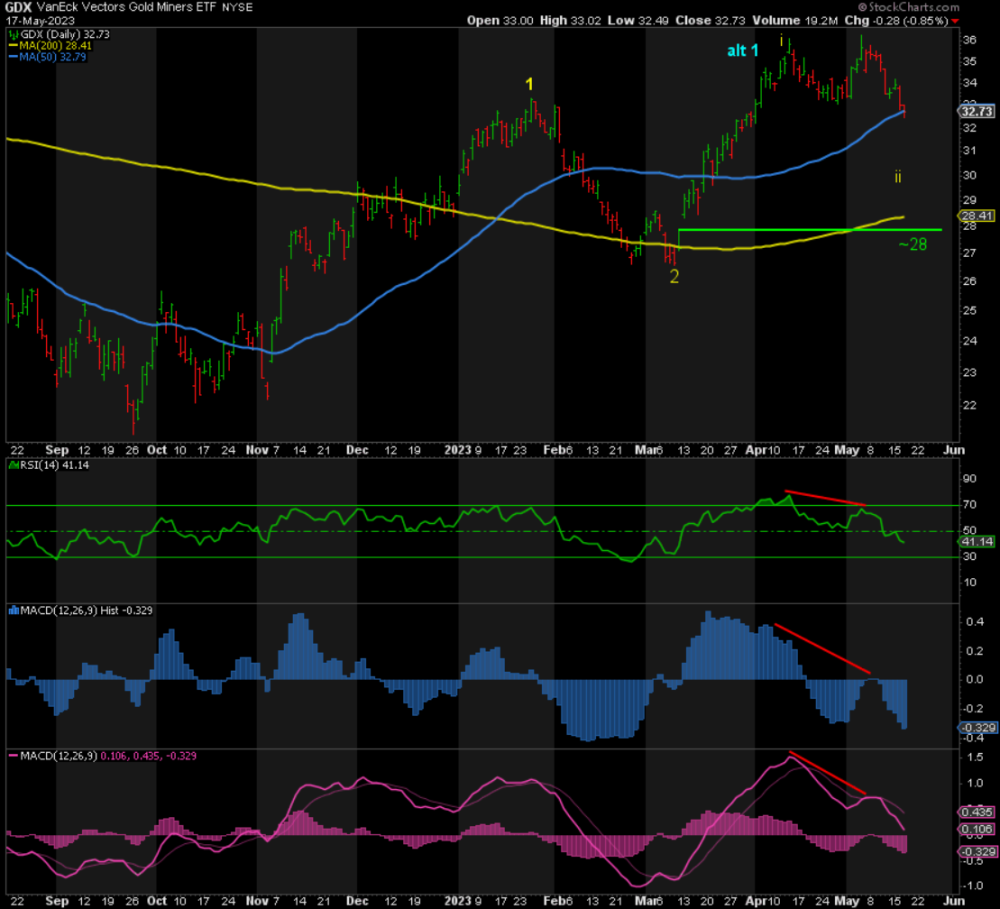
Double top in GDX. It won’t survive a third test, imho. 35.87 was the peak on a closing basis. Support at the recent low of 33.06 has been broken, and now the 50-DMA too. Below there it’s the 200-DMA at 28.41. The next big support level from a technical perspective is ~28, the bottom of the gap left behind in March.
Observing the Fibs between the peak at 35.87 and the two prior lows, we get some areas of confluence.
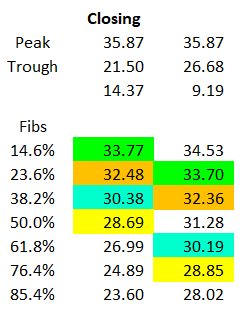
The first is 32.40-50. Assuming that we’re in wave ii of 3, my preferred bottom in GDX is at ~30.19 or ~31.28. However, based on gap left behind, which does not have to be closed (but often is), we could see 28, which ties with the 85.4% Fib from the bottom at 26.68. Simply put, the support levels are 32.40-50, 31.30, 30.20, the 200-DMA, and 28. Resistance is obviously the recent high of 35.87, but a move back above 33 would be encouraging.
SILJ
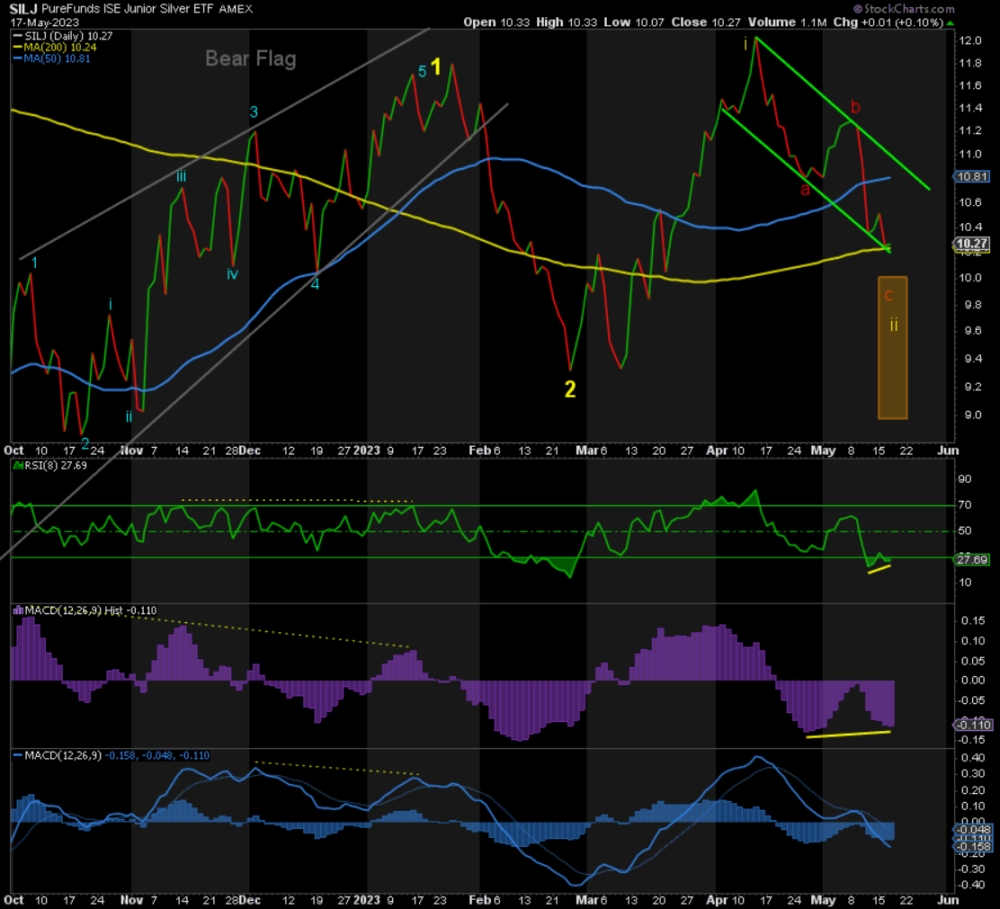
SILJ just hit a confluence of support at the 200-DMA and the bottom of its channel, which is also a bullish flag pattern. It is also a positively divergent low according to both the RSI and the MACD Histogram. However, until we break resistance around 11, there is the risk of lower lows to 9.70-10 to complete wave C of this correction. Worst-case scenario, 9 is possible. If Silver continues to fall, it will be difficult for SILJ to avoid a further drop. On the contrary, SILJ may be signaling a bottom is closer than most think, or at least a healthy bounce is pending.
Conclusion
While the urge may be to buy-the-dip for the rally to follow, until we see a break of resistance, the risk remains down. I don’t recommend trying to catch a falling knife, even if the risk-reward is heavily skewed to the upside, imho. A break back above 2000 in Gold and 24.40 in Silver would certainly increase the probability that the bottom is in. A close above 2055 in Gold and 26.23 in Silver would be a strong indication that we’ll see new record highs in Gold and 30-plus in Silver. Until then, remain patient.
Don’t miss a golden opportunity.
Now that you’ve gained a deeper understanding about gold, it’s time to browse our selection of gold bars, coins, or exclusive Sprott Gold wafers.


About Sprott Money
Specializing in the sale of bullion, bullion storage and precious metals registered investments, there’s a reason Sprott Money is called “The Most Trusted Name in Precious Metals”.
Since 2008, our customers have trusted us to provide guidance, education, and superior customer service as we help build their holdings in precious metals—no matter the size of the portfolio. Chairman, Eric Sprott, and President, Larisa Sprott, are proud to head up one of the most well-known and reputable precious metal firms in North America. Learn more about Sprott Money.
Learn More
You Might Also Like:

Looks like there are no comments yet.