


Did you know you can get the Sprott Money Weekly Wrap Ups, Ask The Expert,
special promotions and insightful blog posts sent right to your inbox?
Sign up to the Sprott Money Newsletter here.
The market has just closed as I begin to write this on Thursday. What a day it was. DXY went ballistic. Gold, Silver, and the miners got creamed from the open after Gold tagged 1980 overnight. Oil was the standout, tagging the magnetic $100 level before going into freefall in a matter of hours. Yields rebounded. And saving the best for last, stocks began their rebound just above the 4100 level, despite all the calls for sub 4000 levels.
Specific to Gold, I shared earlier this week that the Bullion Banks were loading up short again as the Hedge Funds doubled their long position. It was also negatively divergent to the peaks in November and June 2021 on both the RSI and the MACD. Gold was also extreme overbought and bullish. Not unsurprising given that Gold reached its highest level in 18 months. But it also was ripe for a correction. The Ukraine debacle turned out to be a “buy the rumor, sell the fact” event. At least so far.
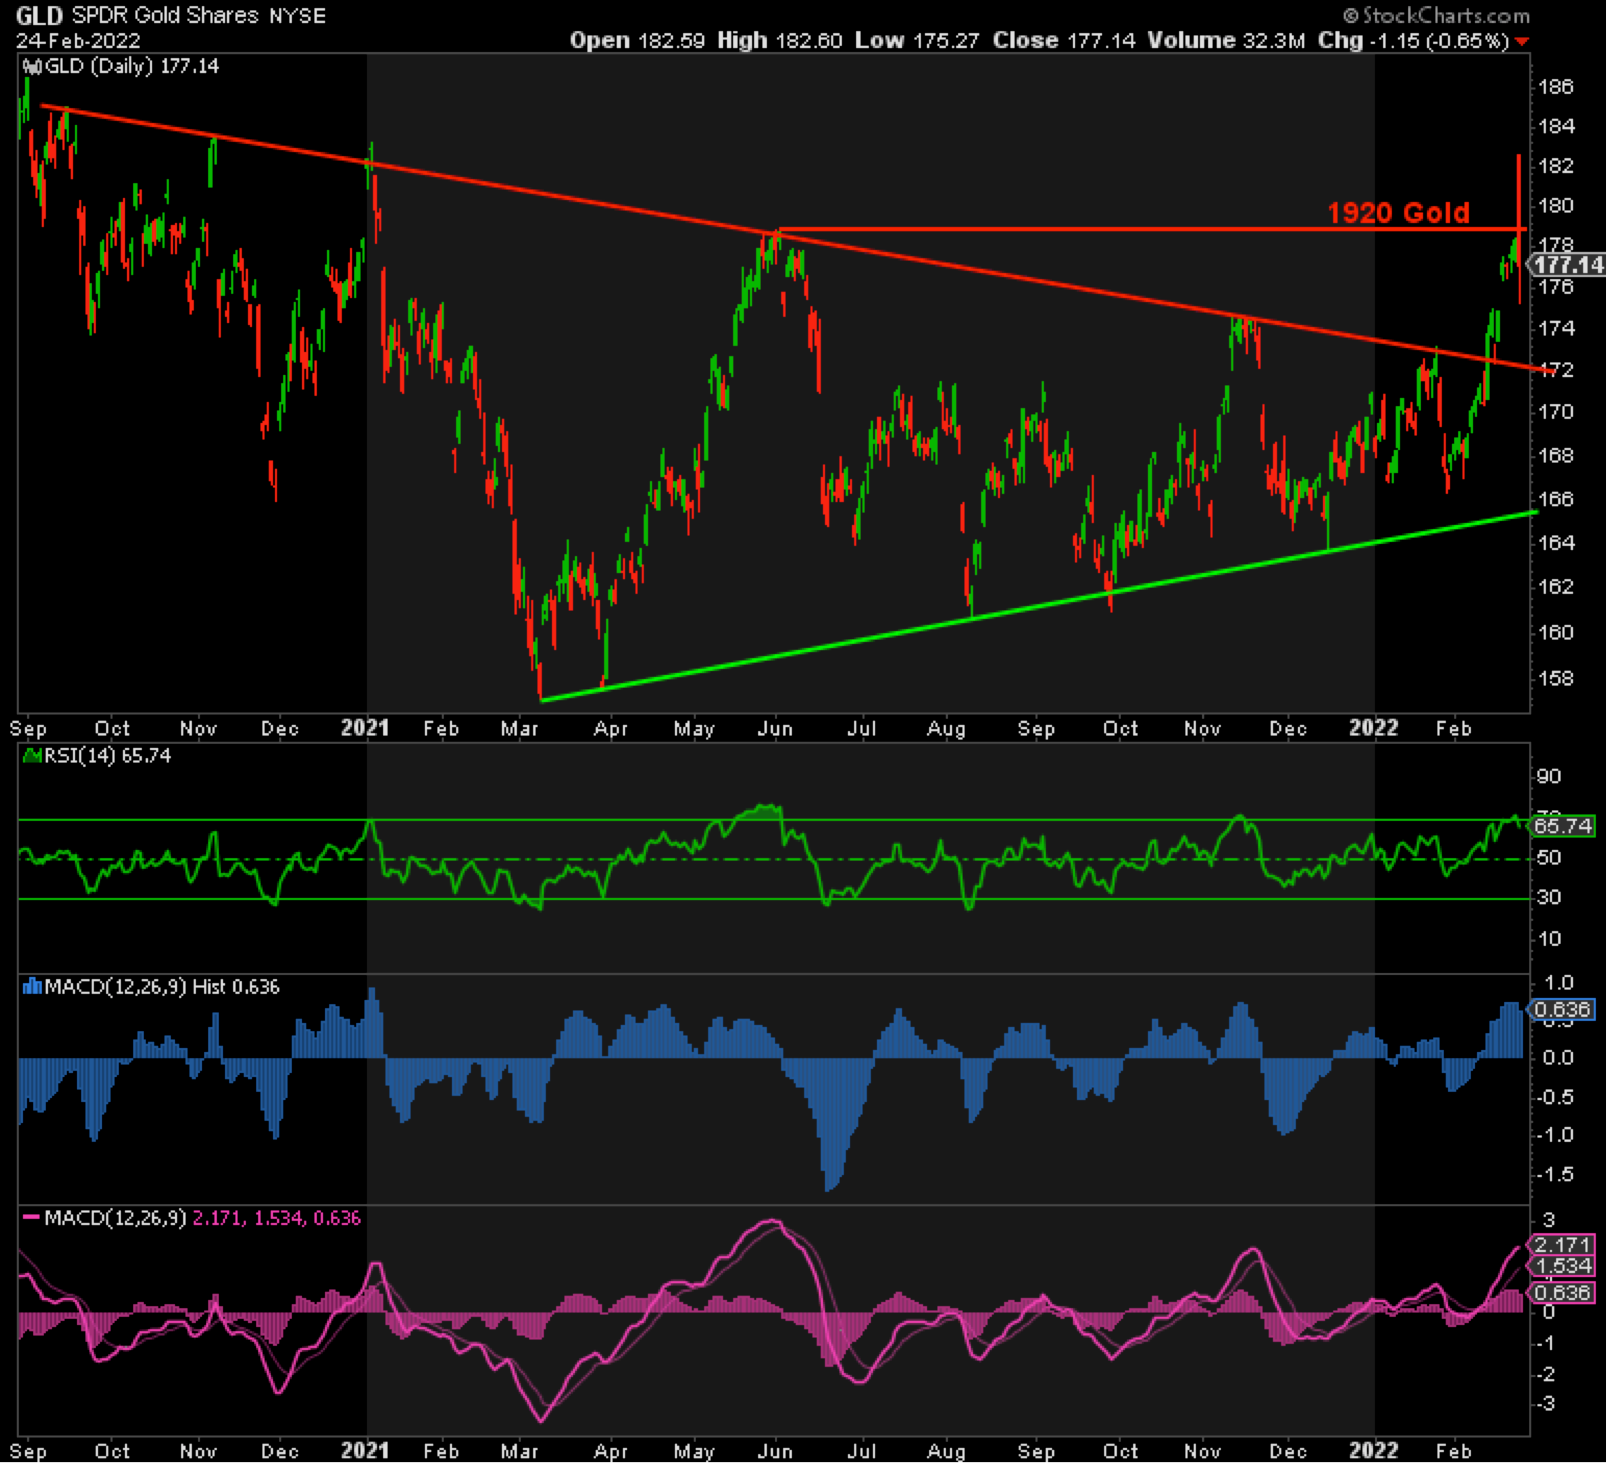
Perhaps most unfortunate for Gold was that it fell like a lead balloon from its peak of 1980 all the way down below 1920 (178.85 GLD) and closed at 1904 (177 GLD). This is worrisome for two reasons. First, we never closed above 1920 so that remains key resistance. Second, this is a clear fake breakout to the upside, which is typically extremely bearish. Should it continue to fall, the next support zone is between 1840-60 (172-173 GLD). Through there and we’re relying on 1780 (166.40 GLD) to hold. The Banks remain heavily short Gold, and Gold has barely corrected its overbought condition.
On a more optimistic note, Gold has been setting higher and higher lows and now has hit higher highs above 1880. It tested 1920 and broke it at least on an intraday basis. If we get another higher low at 1780 or higher and then head up to close above 1920, I’ll feel confident that we’re finally on the way to 2300+. If stocks take another turn down to a lower low and the Fed signals its intention to pause any plans for a rate hike and taper of the balance sheet due to “geopolitical risks”—i.e., Ukraine and Taiwan (convenient excuses for another 180)—then we may get that rally sooner rather than later.
SILVER
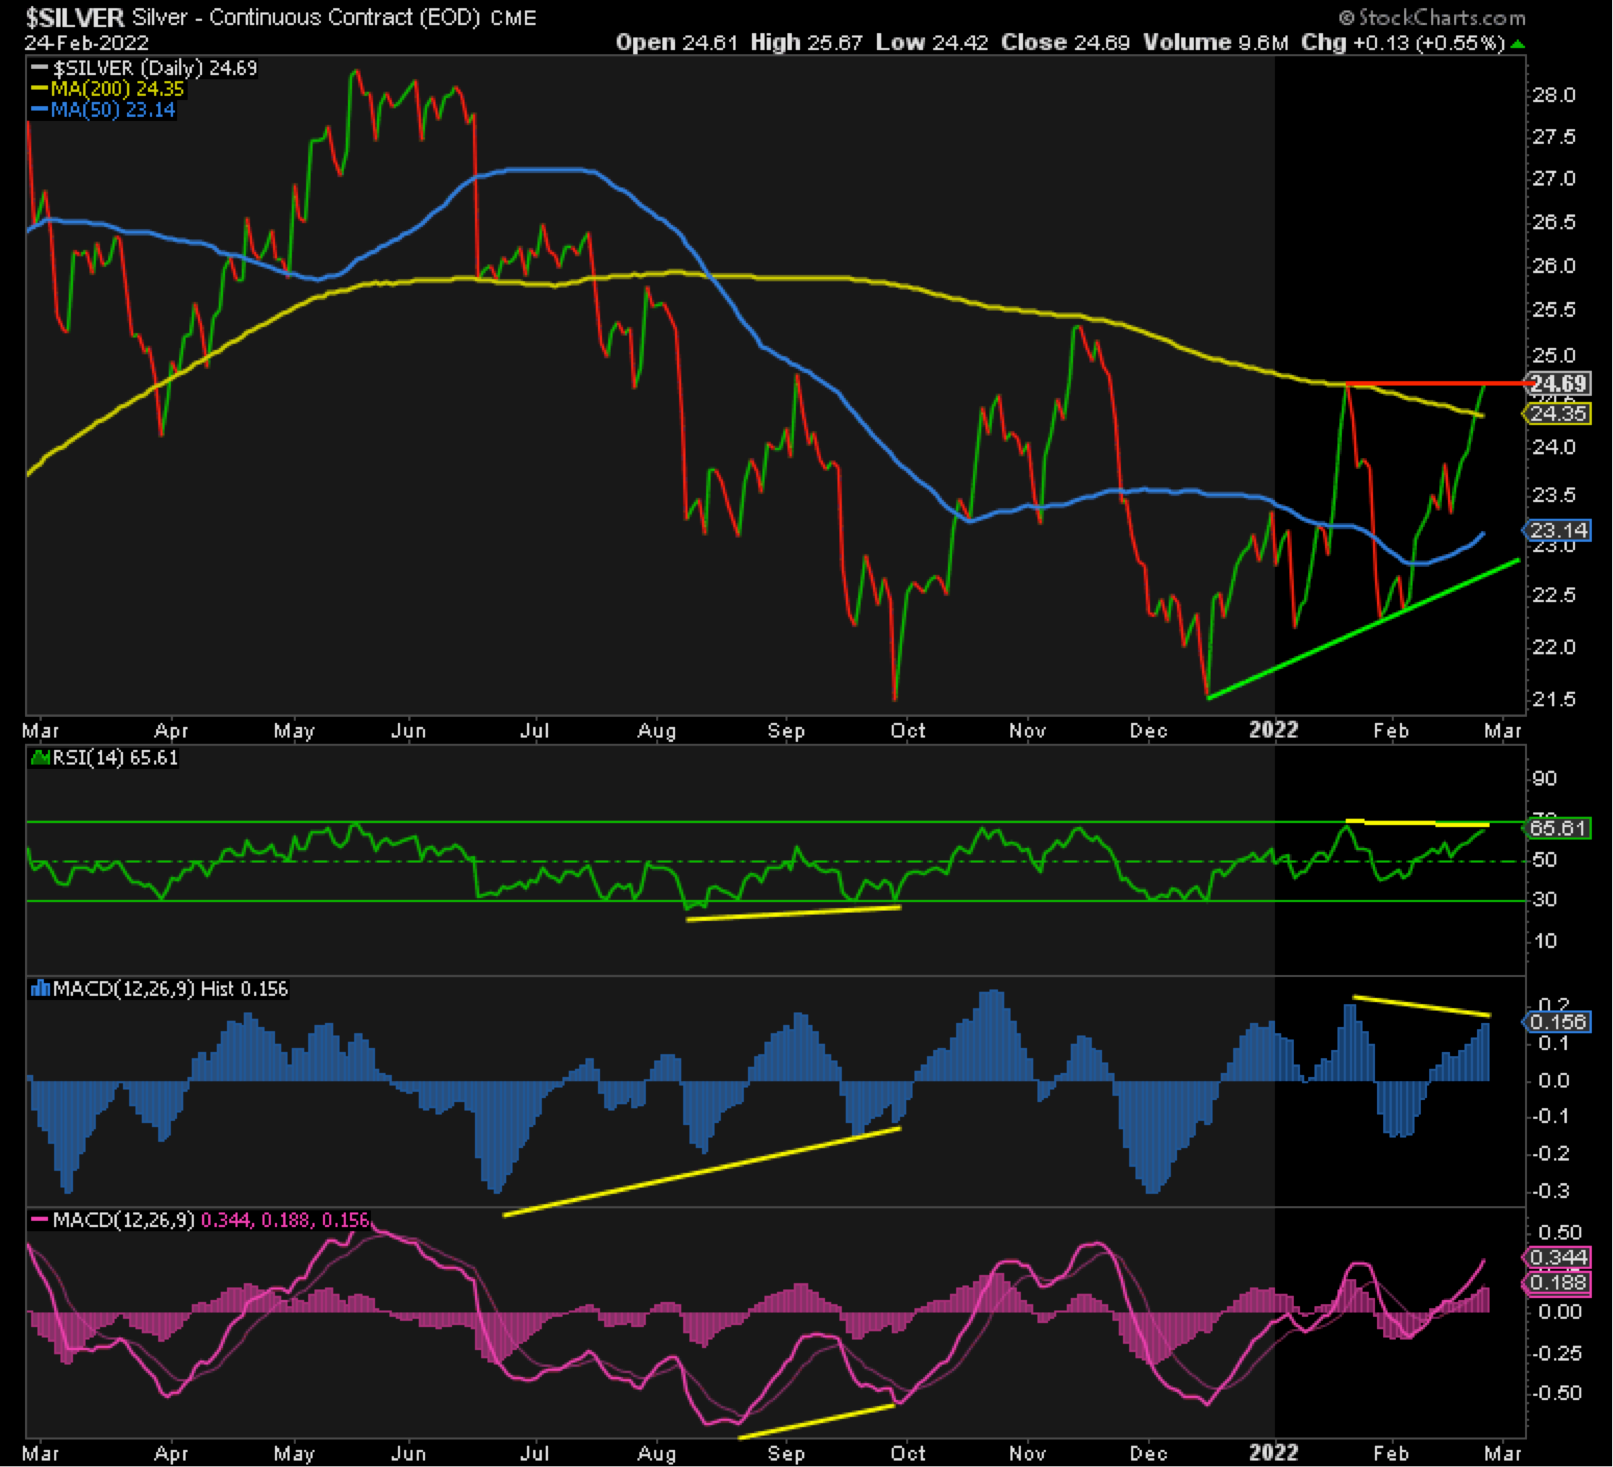
Above are the closing prices for Silver. Just like Gold peaked at 1980, Silver topped out at 25.70, blowing through its 200-day moving average for the first time since April 2021. However, it gave most of that back and closed more or less at the same prior peak of 24.75, but it was clearly negatively divergent in doing so according to the RSI and MACD Histogram. However, the MACD Line hit a micro higher high. This suggests that we’re due for more downside in the short-term, but we’re heading down to a higher low and we’ll close above 24.75 the next time around.
In the interim, 22 is key support on an intra-day basis, and 22.20-30 from a close perspective.
GDX
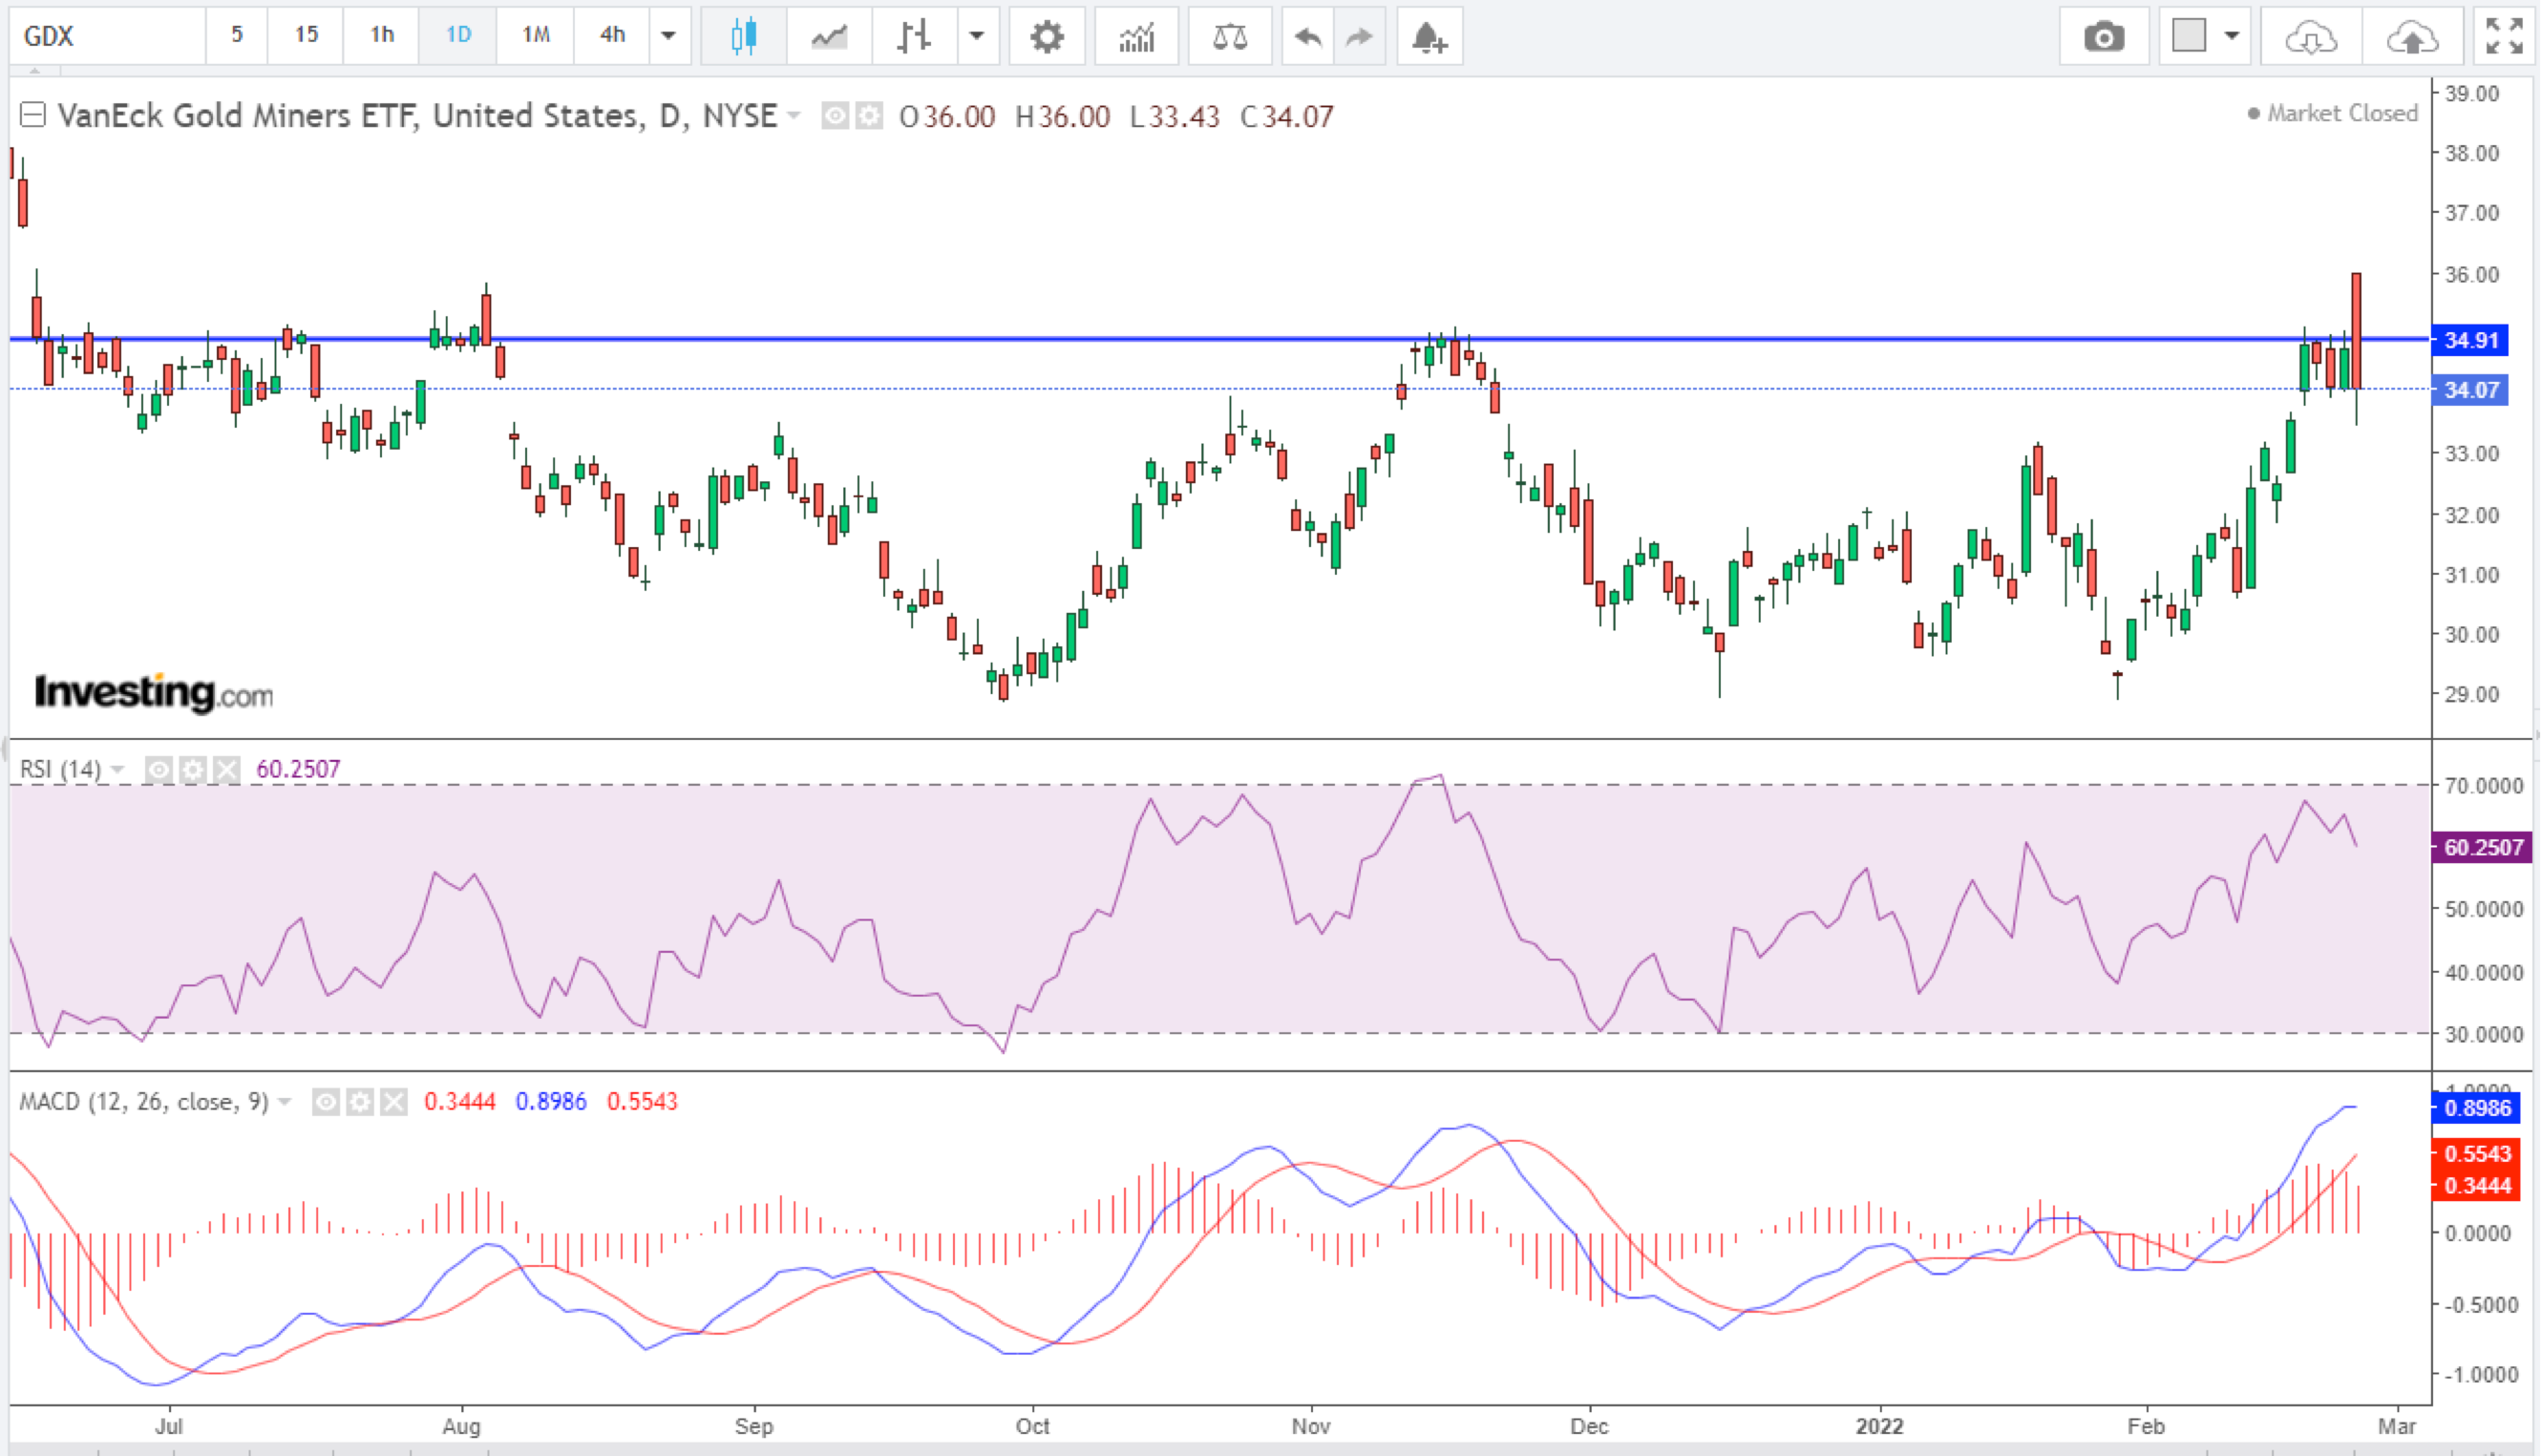
Sorry for the use of a different chart here, but StockCharts appears to have got the close wrong on November 15 relative to several other sources.
The November 15 closing peak was 34.90. Despite four attempts to close above there before today, it failed each and every time. It broke through in style today but once again fell back below 34.90. The RSI was negatively divergent at this double top, signaling further downside ahead. However, just like Silver, the MACD Line made a higher high, suggesting we’re heading down to a higher low next. Support is at 33 and below there, 30.70.
SILJ
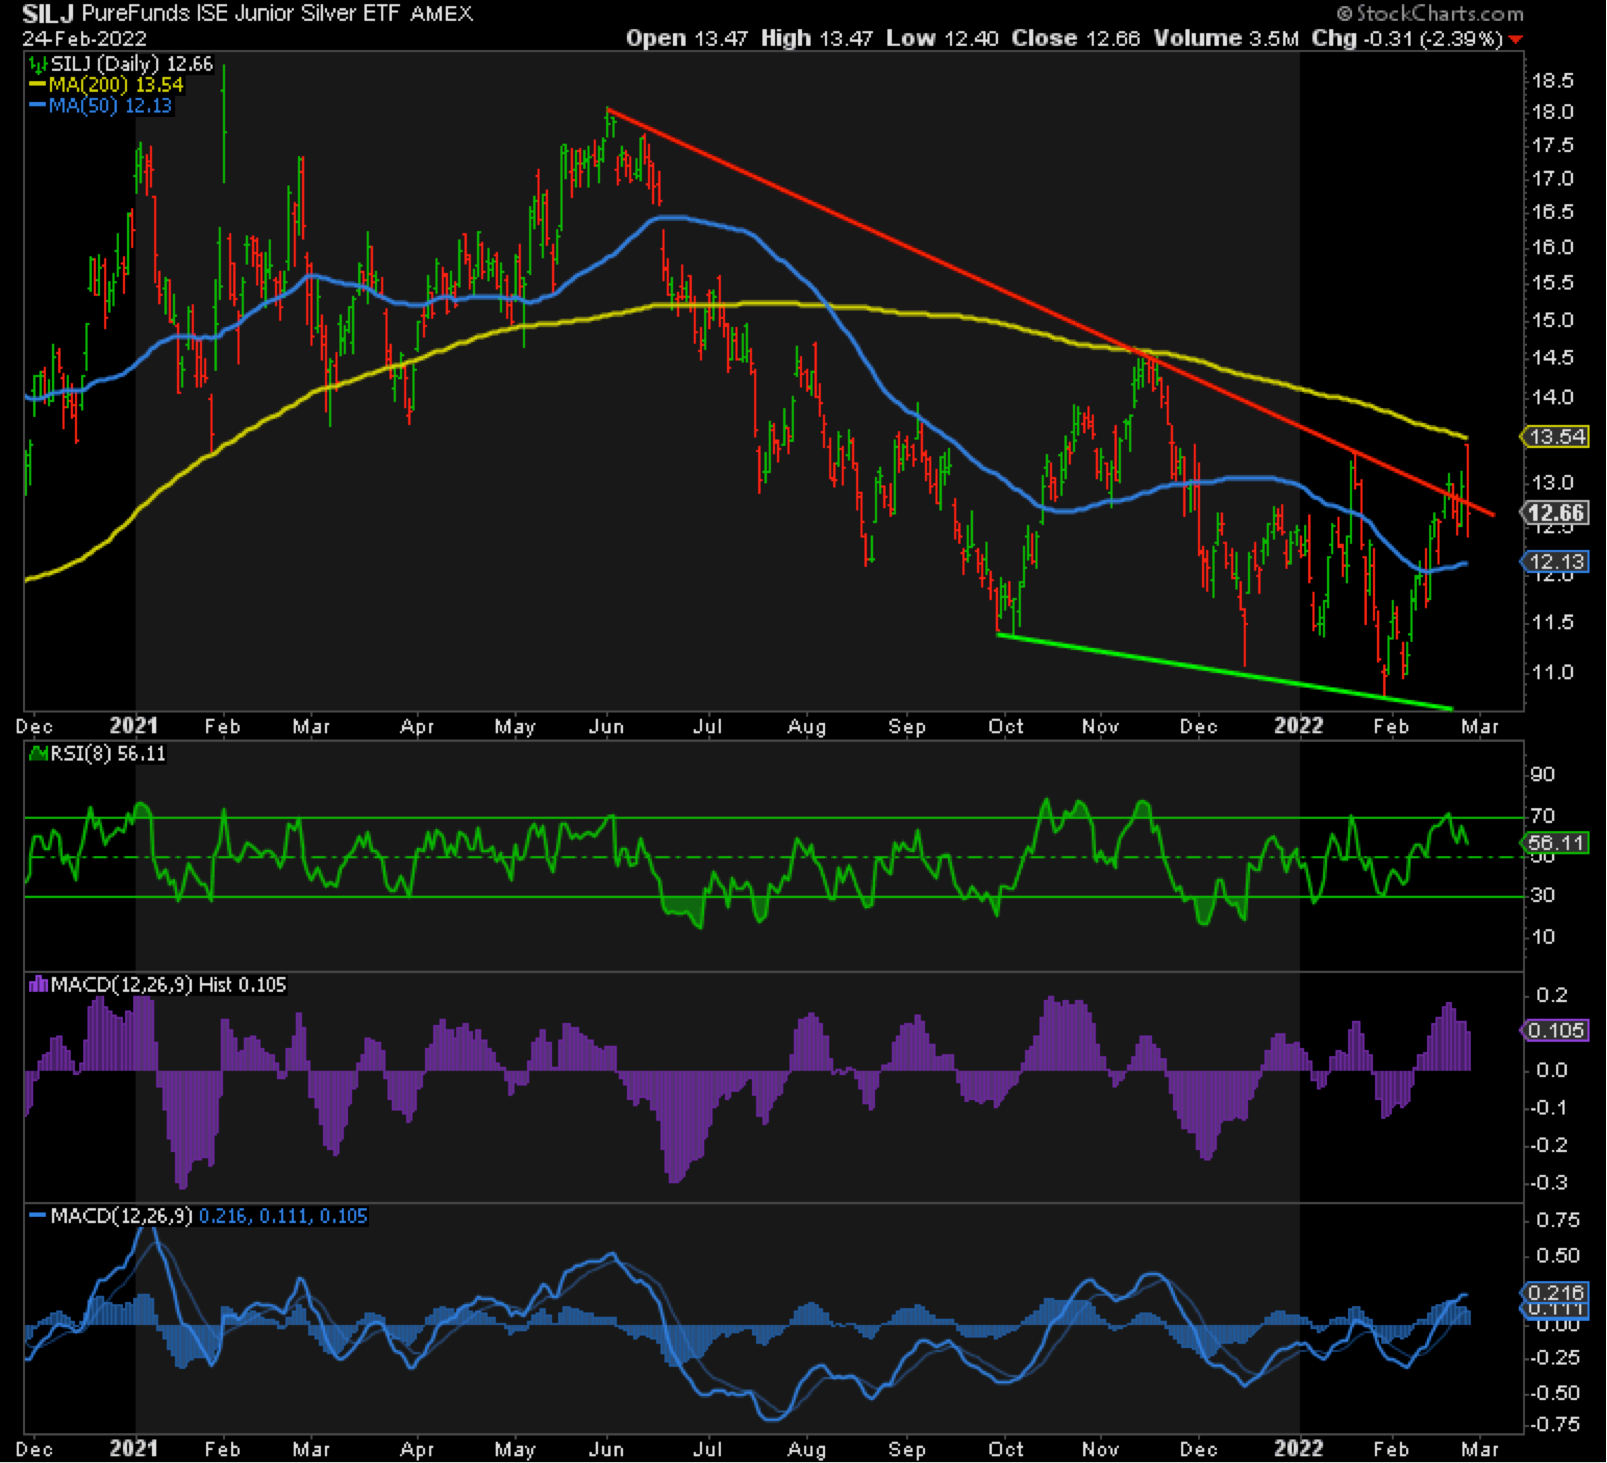
SILJ finally broke downtrend resistance in red but then ran into a brick wall at the 200-day moving average and dumped back below that red resistance line. It also broke its prior high on an intraday basis but then fell back below it again. This is another classic sign of a fake breakout to the upside, which signals further downside ahead. I’m looking for a higher low anywhere above 11 followed by a break of that 200-day moving average to confirm the bottom is in and SILJ is about to go stratospheric!
In conclusion, the data—whether it’s a fake breakout, negative divergence, or still extreme overbought— all suggest we’re going lower in the short-term. But telltale signs from a higher high in the MACD Line also indicate that it is likely to be a higher low next. If that plays out and is followed by a higher high, then the trend has truly turned up, finally!
Don’t miss a golden opportunity.
Now that you’ve gained a deeper understanding about gold, it’s time to browse our selection of gold bars, coins, or exclusive Sprott Gold wafers.


About Sprott Money
Specializing in the sale of bullion, bullion storage and precious metals registered investments, there’s a reason Sprott Money is called “The Most Trusted Name in Precious Metals”.
Since 2008, our customers have trusted us to provide guidance, education, and superior customer service as we help build their holdings in precious metals—no matter the size of the portfolio. Chairman, Eric Sprott, and President, Larisa Sprott, are proud to head up one of the most well-known and reputable precious metal firms in North America. Learn more about Sprott Money.
Learn More
You Might Also Like:

Looks like there are no comments yet.