


Did you know you can get the Sprott Money Weekly Wrap Ups, Ask The Expert,
special promotions and insightful blog posts sent right to your inbox?
Sign up to the Sprott Money Newsletter here.
Short and sweet this week. We have the PPI on tap tomorrow (writing this on Thursday), the CPI on Monday, and the FOMC on Wednesday.
If the PPI and/or the CPI come in higher than expected, the pullbacks in metals and miners will be in full swing and the DXY rallies. Then, if the Fed raises 50bp, that likely signals the bottom in Wave 2. If they hike 75bp, Gold and the rest suffer a deeper dive.
If the PPI and/or the CPI come in lower than expected, then we should be a lock for 50bp, and up we go in both metals and miners to a higher high before the wave pullback begins.
Either way, a pullback in the monetary metals is coming.
GOLD
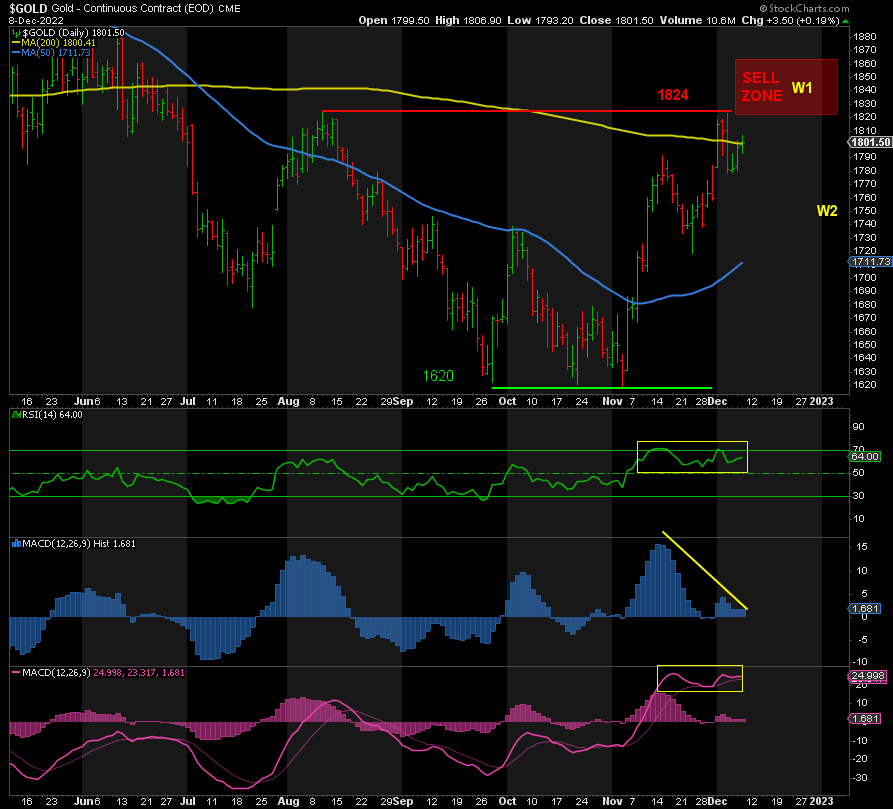
Gold has rallied up to prior resistance at 1824 and stalled there. It is struggling to stay above the 200-DMA. Sentiment is obviously extremely bullish, which is a contrarian signal.
The RSI and the MACD Line are in overbought territory and the MACD Histogram is negatively divergent, which suggests a move down to 1750 and then up to somewhere around 1850 for its peak in Wave 1, followed by a bigger pullback in Wave 2.
If it goes straight up to 1850, we could see an even bigger drop thereafter.
Once we bottom out in Wave 2, I expect Gold to soar in Wave 3 on its way to new record highs at 2300+. Again, this will likely be aided by lower bond yields and a softer Fed.
SILVER
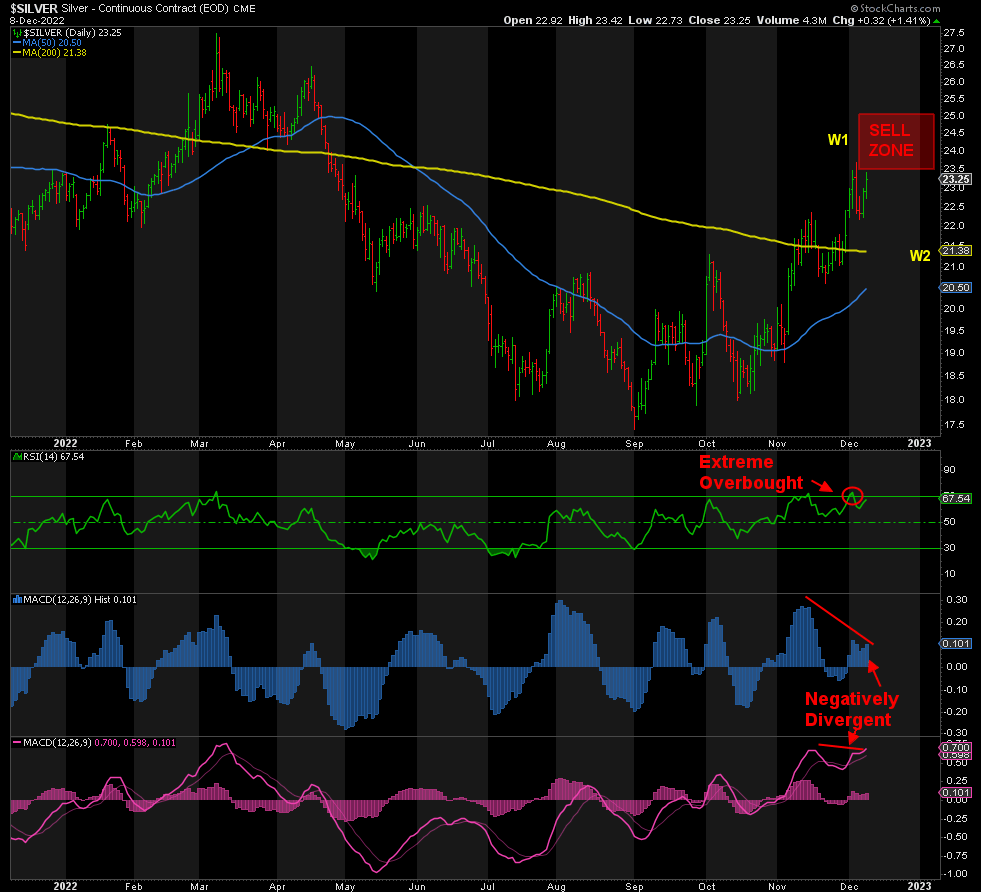
Silver has reached a peak of 23.70, and it’s also extremely bullish and flirting with overbought territory. This may be the peak of Wave 1 or we have another leg higher to go, perhaps as high as 25.
Alternatively, we have already begun a correction back down to a 21 handle in Wave 2.
The negative divergences in both MACDs suggests the latter, but one more pop can’t be ruled out yet.
When we bottom in Wave 2, then Wave 3 begins the march to 35-45, imho.
GDX
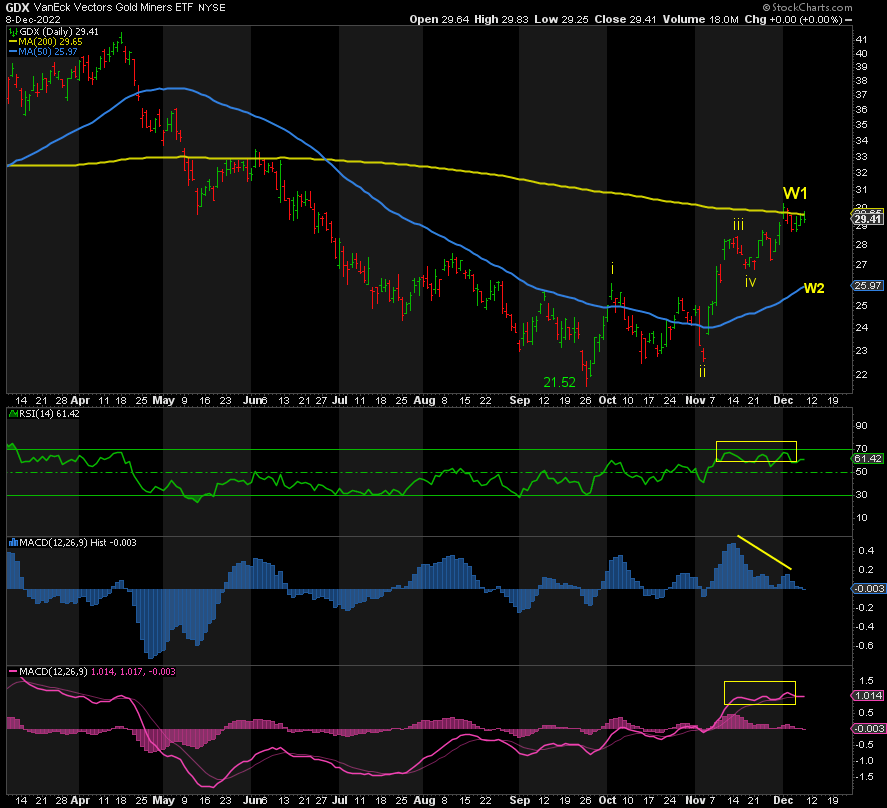
Same goes for GDX in that it has run into resistance at the 200-DMA, it’s flirting with overbought territory, and it’s negatively divergent per the MACD Histogram. But we can’t rule out a higher high in Wave 1 to 31-32 yet. Events in the coming days will clear this up one way or the other. But as with the metals, miners are due a pullback either way.
SILJ
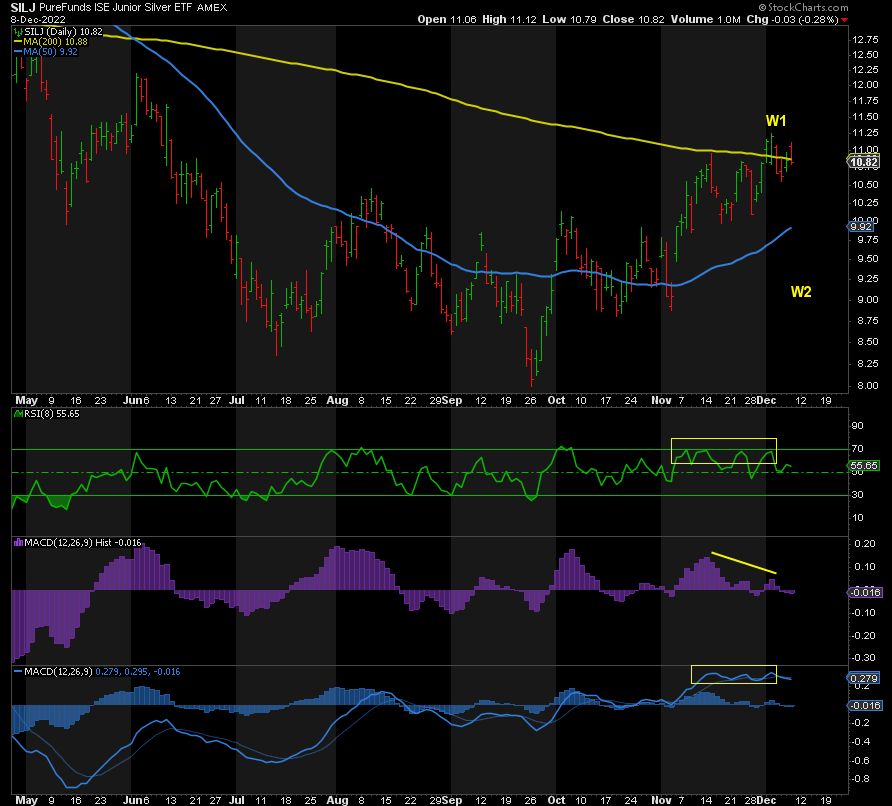
It’s no surprise that SILJ is also struggling at its 200-DMA, and it’s got one more higher high to come before it heads south.
DXY
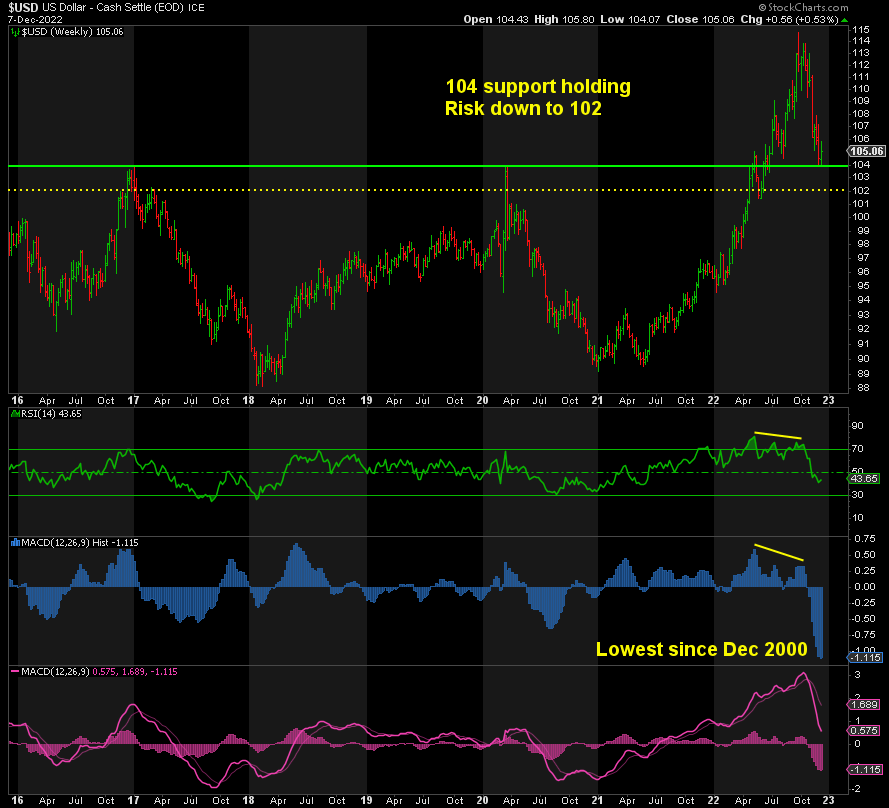
The DXY’s fall has been a key contributor to gains in metals and miners. It has run into former resistance, now support, at 104 and held it so far. The big question is whether it is done on the downside or it has one more lower low to the 50% Fibonacci level at 102. Either way, it is due a big bounce to 108-110, imho. If the inverse correlation continues, this supports the pullback in metals and miners.
BOND YIELDS
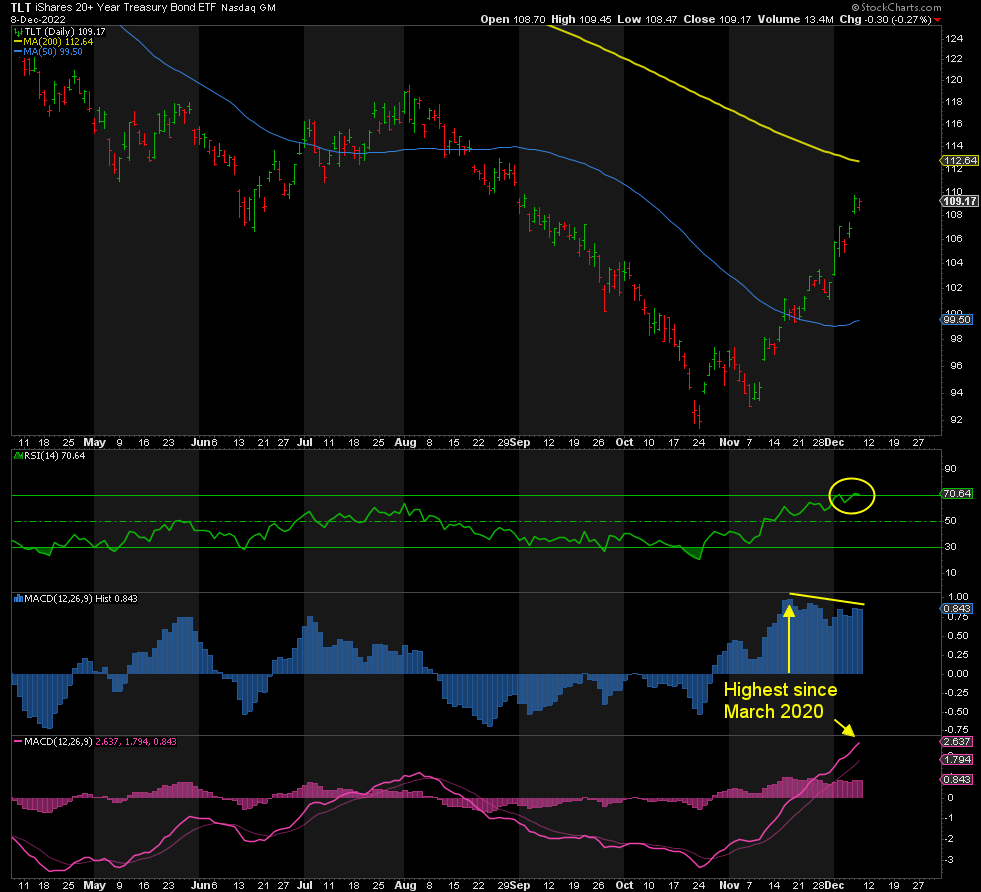
While I believe long bond yields have peaked and the 10-Year Treasury is heading down to 1.50%, TLT shows that bonds have had a good run lately as yields drop. The problem now is that TLT is extreme overbought across all indicators and negatively divergent per the MACD Histogram in blue. While it may take a shot at the 200-DMA or go straight down from here, a pullback is coming, meaning higher yields in the short-term. This would likely support a rebound in DXY and contribute to the pullbacks in metals and miners.
In summary, Gold, Silver, and the miners may have one more higher high or have already peaked, but we’re getting a pullback in Wave 2 one way or another, aided by both bond yields and the dollar.
Don’t miss a golden opportunity.
Now that you’ve gained a deeper understanding about gold, it’s time to browse our selection of gold bars, coins, or exclusive Sprott Gold wafers.

About Sprott Money
Specializing in the sale of bullion, bullion storage and precious metals registered investments, there’s a reason Sprott Money is called “The Most Trusted Name in Precious Metals”.
Since 2008, our customers have trusted us to provide guidance, education, and superior customer service as we help build their holdings in precious metals—no matter the size of the portfolio. Chairman, Eric Sprott, and President, Larisa Sprott, are proud to head up one of the most well-known and reputable precious metal firms in North America. Learn more about Sprott Money.
Learn More

You Might Also Like:

Looks like there are no comments yet.