


Did you know you can get the Sprott Money Monthly Wrap Ups, Ask The Expert,
special promotions and insightful blog posts sent right to your inbox?
Sign up to the Sprott Money Newsletter here.
By now, you likely know that an inverted yield curve is almost always a precursor of economic contraction and recession. But can the yield curve tell you when the recession has actually begun? Let's explore that today.
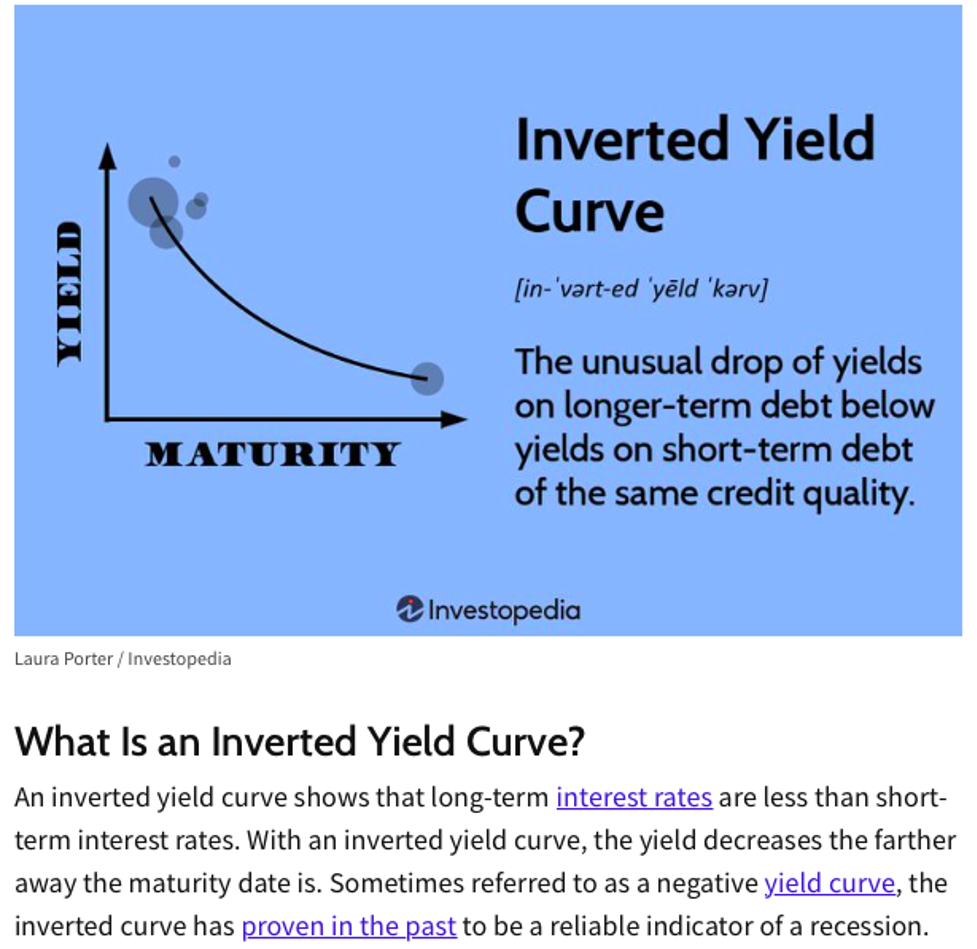
First of all, what is an "inverted yield curve"? Well, the natural slope of the yield curve is positive, meaning short-term interest rates are lower than long-term interest rates. The opposite of this appears occasionally when short-terms rates are higher than long-term rates. The result is what's called an inverted yield curve. From Investopedia:
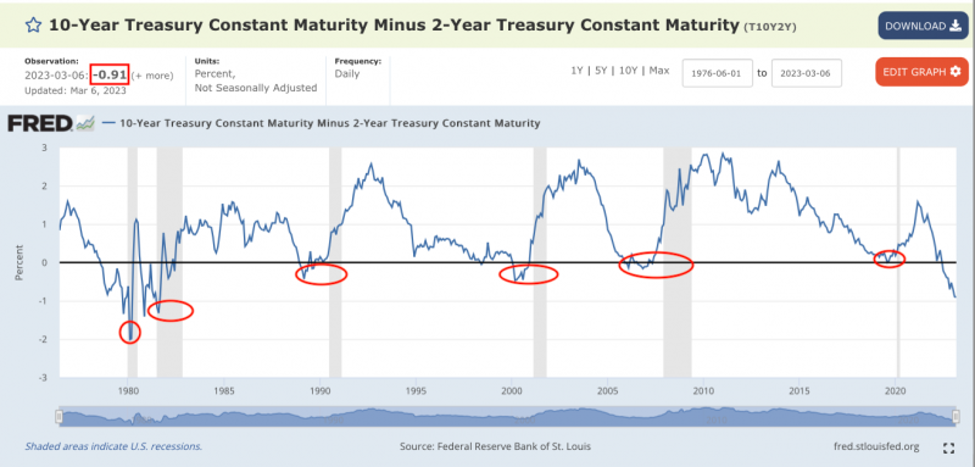
The chart below is taken from The Federal Reserve's own research site. What you see is the spread or "curve" of the U.S. 2-year note versus the U.S. 10-year note. Over the past 40 years, this spread is almost always positive. However and as you can see, there are periods where the curve inverts and, most importantly, a recession (marked in gray) has followed each time.
So an inverted yield curve has a perfect track record in predicting recessions. The only problem is that an inverted curve by itself does not tell you WHEN the recession will begin. For that, we have to look again at the same chart. This time, note the red arrows:
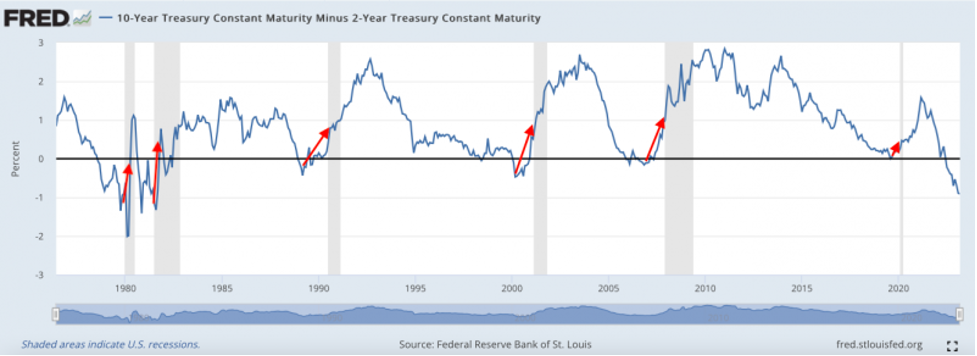
AHA! Now we're onto something!! The chart above clearly shows that recession is imminent once the yield curves stops inverting and begins to move toward flattening. If this situation holds again in 2023...and why wouldn't it?...then we'll need to watch for this pattern to repeat.
So far this year, the yield curve inversion has continued to steepen. The yield on the 2-year note finished 2022 at 4.43% while the 10-year note was at 3.88%. That was an inversion of 0.55% or 55 basis points. However, as I type this on March 7, the yield on the 2-year note is currently at 4.96% and the 10-year is at 3.95%. That's an inversion of 101 basis points and the widest, most negative this spread has been since 1981!
Clearly, the recession-signal flattening has yet to begin. It's most definitely coming, however. Of that, you can be certain.
And what would drive a flattening of the curve? Well, that's pretty simple:
- short rates begin to rise more slowly than long rates OR
- short rates fall while long rates hold steady OR
- short rates fall while long rates rise OR
- short rates fall faster than long rates
What's most likely is that short rates will soon begin to fall and narrow the gap versus longer rates. What would cause short rates to fall? An end to fed funds rate hikes would do it but I suspect it will be something more "organic" and market-oriented.
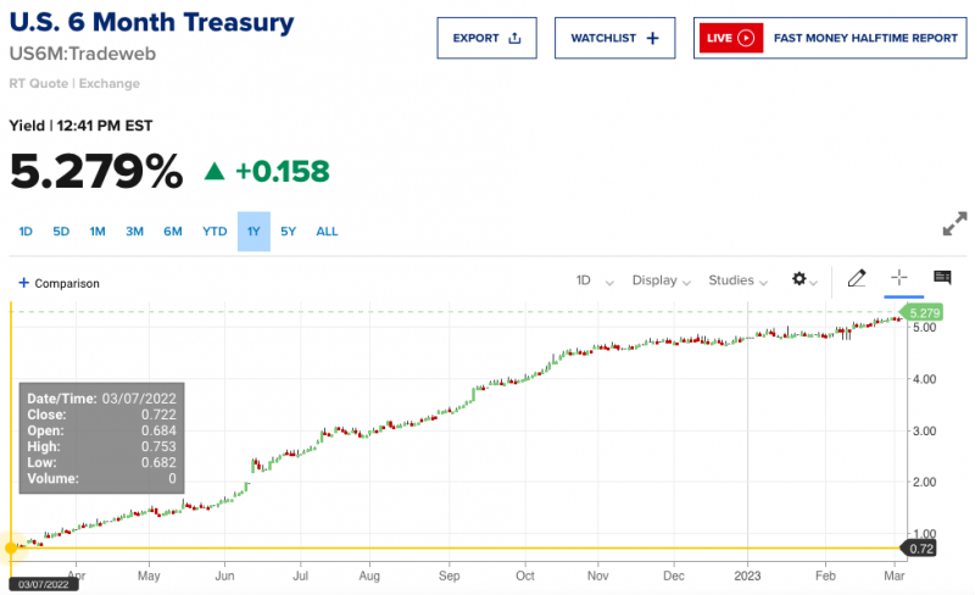
For example, right now at the shortest end of the yield curve, an investor can buy a 6-month U.S. treasury bill with a yield of 5.28%. That's only about 4.50% higher than it was last year at this time!
And now put yourself in the shoes of a hedge fund or institutional money manager. Locking up some cash at 1% a year ago may not have sounded like a good proposition. However, in 2023, 5.25% for six months may not seem half-bad, especially when you consider the risks inherent in other asset classes.
So what happens next? Perhaps despite The Fed's hawkishness, yields on short-term treasuries begin to fall as demand for the paper begins to escalate. Perhaps this demand leads to a small shift in asset allocation from equities to bonds? Stock prices begin to drop and this only serves to accelerate demand for "safe haven" assets. More cash flows into bonds and short-term yields fall even further.
In this scenario, short-rates likely fall faster than longer-rates as demand boosts the price of 2-year notes while inflation concerns keep longer rates steady. And suddenly, what do you have? A yield curve where the inversion has peaked and has begun to flatten. And what do those FRED chart above show? That a flattening yield curve occurs as the economy finally enters a clear and demonstrable recession.
So why is this important to precious metal enthusiasts? Because once The Fed senses recession, they will quickly alter the course of their current rate hike scheme. Next year is a presidential election year in the U.S. and The Fed will want no part of seeming to tip the scales of the election by driving the economy into the ditch in the months before the voting.
Therefore, at the first clear sign of recession, The Fed will finally "pause and pivot"...just as they did in 2010, 2016 and 2019. In each of those years, COMEX gold prices sensed this new trend and responded with sharp rallies that continued for months. Look for the same to occur later this year and through 2024.
The flattening of the yield curve will be your tell that this trend change is upon us and that the recession has begun. The current shape of the curve shows that we're not there yet. History, however, demonstrates that we will be there soon enough.
Don’t miss a golden opportunity.
Now that you’ve gained a deeper understanding about gold, it’s time to browse our selection of gold bars, coins, or exclusive Sprott Gold wafers.


About Sprott Money
Specializing in the sale of bullion, bullion storage and precious metals registered investments, there’s a reason Sprott Money is called “The Most Trusted Name in Precious Metals”.
Since 2008, our customers have trusted us to provide guidance, education, and superior customer service as we help build their holdings in precious metals—no matter the size of the portfolio. Chairman, Eric Sprott, and President, Larisa Sprott, are proud to head up one of the most well-known and reputable precious metal firms in North America. Learn more about Sprott Money.
Learn More

You Might Also Like:

Looks like there are no comments yet.