facebook
back to top
News

Half Done Is Just Begun

price volatility

First Half of 2024 Recap: Gold and Silver Prices

It has been a very busy first half of 2024 for gold and silver prices, and price volatility should be expected to continue through the second half of the year. With that in mind, let's take stock of what has been accomplished so far and what we might expect in the months to come.


Market Overview: Changes Since January 2024

It may seem hard to believe but the first half of 2024 comes to a close this week as Friday marks the final trading day of June and the end of the second quarter. The investment/economic world looks quite different today than it did when the year began, but the precious metals have managed the situation far better than we might have expected.

We began the year with the dollar index near 101, the yield on the 10-year note at 3.95%, and an expectation that the Fed might cut the fed funds rate as many as six or seven times in 2024. Six months later, the dollar index is near 105, the yield on the 10-year is at 4.25%, and no one can agree on whether or not the Fed will cut rates even once this year. All the while...

  • Spot gold began the year at $2063. It's now $2326. That's +12.7%.
  • Spot silver began the year at $23.79. It's now $29.60 for a gain of 24.4%.


Looking Ahead: Expectations for Gold and Silver Prices in the Second Half of 2024

So how will the second half of 2024 treat gold and silver prices? Can we duplicate those gains? Maybe. But let's see if we can make it through this week before getting too far ahead of ourselves.


Upcoming Economic Data and Market Volatility

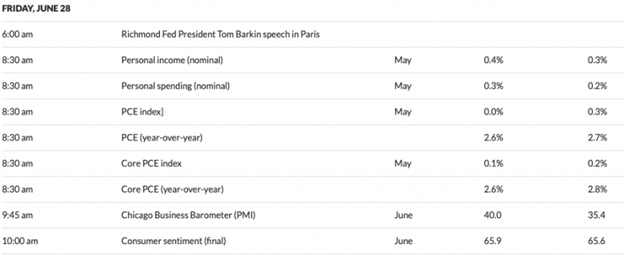
The week ahead will bring some interesting economic data, the most significant of which will come on Friday with the latest PCE, Core PCE, personal income, and spending data. These reports will move the markets, and coming on the final day of the quarter, you can expect plenty of volatility and possible chart-painting before the week ends.
**First Half of 2024 Recap: Gold and Silver Prices**  It has been a very busy first half of 2024 for gold and silver prices, and price volatility should be expected to continue through the second half of the year. With that in mind, let's take stock of what has been accomplished so far and what we might expect in the months to come.  **Market Overview: Changes Since January 2024**  It may seem hard to believe but the first half of 2024 comes to a close this week as Friday marks the final trading day of June and the end of the second quarter. The investment/economic world looks quite different today than it did when the year began, but the precious metals have managed the situation far better than we might have expected.  We began the year with the dollar index near 101, the yield on the 10-year note at 3.95%, and an expectation that the Fed might cut the fed funds rate as many as six or seven times in 2024. Six months later, the dollar index is near 105, the yield on the 10-year is at 4.25%, and no one can agree on whether or not the Fed will cut rates even once this year. All the while...  - Spot gold began the year at $2063. It's now $2326. That's +12.7%. - Spot silver began the year at $23.79. It's now $29.60 for a gain of 24.4%.  **Looking Ahead: Expectations for Gold and Silver Prices in the Second Half of 2024**  So how will the second half of 2024 treat gold and silver prices? Can we duplicate those gains? Maybe. But let's see if we can make it through this week before getting too far ahead of ourselves.  **Upcoming Economic Data and Market Volatility**  The week ahead will bring some interesting economic data, the most significant of which will come on Friday with the latest PCE, Core PCE, personal income, and spending data. These reports will move the markets, and coming on the final day of the quarter, you can expect plenty of volatility and possible chart-painting before the week ends.  **COMEX Expirations and Their Impact on Gold and Silver Prices**  The other big events this week deal with COMEX expirations. Options for July expire and price at the COMEX close on Tuesday, and then the current front month Jul24 silver contract goes off the board and into "delivery" at the close on Thursday.  **Option Expiration Analysis for Gold and Silver**  Regarding option expiration, sometimes we can look at the board of total option open interest and derive a "sweet spot" for price where the settlement of in-the-money puts and calls inflicts the smallest amount of financial pain for the option writers. For Tuesday's expiration, the board is pretty diffuse but still noteworthy. Let's start with COMEX gold, where July is not a front month but there is a significant amount of options expiring regardless.  To me, the chart below suggests that a price level of "minimum pain" is somewhere near $2355. Below there, a lot of puts move into the money, and above there, more calls become profitable. Again though, it's not overly dramatic and next month will have higher volumes.  The picture for COMEX silver is clearer. Why was price rigged violently lower last Friday—the third Friday of the last four where price was hammered during the COMEX session—when it dropped back below $30? Well, part of the rationale was weekly chart painting and psychological impacts. However, as you can see below, there's a clear option expiration rationale too. Note the 2.5X disparity between the number of open calls versus puts at the $30 strike price.  As such, and though unexpected events can always intervene, you should expect the COMEX price to close below $30 on Tuesday. Once option expiration is behind us, we may be able to rally into the end of the week, month, and quarter. Much will depend, however, on how the bond market and dollar index react to all of that data on Friday, so keep an eye on the headlines later this week.  **Future Price Trends: Gold and Silver Forecast for 2024**  And where might prices head as the second half of 2024 begins? The charts suggest a return to the uptrend if the current consolidation patterns can be successfully resolved. For now, COMEX gold is progressing through a consolidation phase between $2300 and $2450. A sustained breakdown would open the door to a deeper pullback to near $2250, but the next rally phase will target $2650. Again, though, price is locked in the range shown below for now.  COMEX silver is also in a consolidation or "bull flag" phase. However, it is finding stout support at the confluence of three important factors:  - $29 horizontal support - Its 50-day moving average - Its trendline from the February 29 onset of this current rally  On the chart above, note that the first bull flag breakout led to a quick run back to the prior resistance at $29 and then a rally to $32.50. If price can successfully resolve this current flag, we should see a similar pattern of a run to the previous resistance near $32.50, and once that level is broken, a move to new highs near $34 or even $36 will unfold before the next consolidation phase begins.  But let's not get too far ahead of ourselves today. Instead, let's first navigate a possible turbulent final week of Q2. We can begin to fully focus on the back half of 2024 once the calendar flips to July.

COMEX Expirations and Their Impact on Gold and Silver Prices

The other big events this week deal with COMEX expirations. Options for July expire and price at the COMEX close on Tuesday, and then the current front month Jul24 silver contract goes off the board and into "delivery" at the close on Thursday.


Option Expiration Analysis for Gold and Silver

Regarding option expiration, sometimes we can look at the board of total option open interest and derive a "sweet spot" for price where the settlement of in-the-money puts and calls inflicts the smallest amount of financial pain for the option writers. For Tuesday's expiration, the board is pretty diffuse but still noteworthy. Let's start with COMEX gold, where July is not a front month but there is a significant amount of options expiring regardless.

To me, the chart below suggests that a price level of "minimum pain" is somewhere near $2355. Below there, a lot of puts move into the money, and above there, more calls become profitable. Again though, it's not overly dramatic and next month will have higher volumes.

gold price chart


The picture for COMEX silver is clearer. Why was price rigged violently lower last Friday—the third Friday of the last four where price was hammered during the COMEX session—when it dropped back below $30? Well, part of the rationale was weekly chart painting and psychological impacts. However, as you can see below, there's a clear option expiration rationale too. Note the 2.5X disparity between the number of open calls versus puts at the $30 strike price.

gold price chart


As such, and though unexpected events can always intervene, you should expect the COMEX price to close below $30 on Tuesday. Once option expiration is behind us, we may be able to rally into the end of the week, month, and quarter. Much will depend, however, on how the bond market and dollar index react to all of that data on Friday, so keep an eye on the headlines later this week.


Future Price Trends: Gold and Silver Forecast for 2024

And where might prices head as the second half of 2024 begins? The charts suggest a return to the uptrend if the current consolidation patterns can be successfully resolved. For now, COMEX gold is progressing through a consolidation phase between $2300 and $2450. A sustained breakdown would open the door to a deeper pullback to near $2250, but the next rally phase will target $2650. Again, though, price is locked in the range shown below for now.

gold price chart


COMEX silver is also in a consolidation or "bull flag" phase. However, it is finding stout support at the confluence of three important factors:

  • $29 horizontal support
  • Its 50-day moving average
  • Its trendline from the February 29 onset of this current rally

gold price chart

On the chart above, note that the first bull flag breakout led to a quick run back to the prior resistance at $29 and then a rally to $32.50. If price can successfully resolve this current flag, we should see a similar pattern of a run to the previous resistance near $32.50, and once that level is broken, a move to new highs near $34 or even $36 will unfold before the next consolidation phase begins.

But let's not get too far ahead of ourselves today. Instead, let's first navigate a possible turbulent final week of Q2. We can begin to fully focus on the back half of 2024 once the calendar flips to July.

Don’t miss a golden opportunity.

Now that you’ve gained a deeper understanding about gold, it’s time to browse our selection of gold bars, coins, or exclusive Sprott Gold wafers.

About Sprott Money

Specializing in the sale of bullion, bullion storage and precious metals registered investments, there’s a reason Sprott Money is called “The Most Trusted Name in Precious Metals”.

Since 2008, our customers have trusted us to provide guidance, education, and superior customer service as we help build their holdings in precious metals—no matter the size of the portfolio. Chairman, Eric Sprott, and President, Larisa Sprott, are proud to head up one of the most well-known and reputable precious metal firms in North America. Learn more about Sprott Money.

Learn More
about-sprott-skyline
Head shot of Craig Hemke

About the Author

Our Ask The Expert interviewer Craig Hemke began his career in financial services in 1990 but retired in 2008 to focus on family and entrepreneurial opportunities.

Since 2010, he has been the editor and publisher of the TF Metals Report found at TFMetalsReport.com, an online community for precious metal investors.

*The author is not affiliated with, endorsed or sponsored by Sprott Money Ltd. The views and opinions expressed in this material are those of the author or guest speaker, are subject to change and may not necessarily reflect the opinions of Sprott Money Ltd. Sprott Money does not guarantee the accuracy, completeness, timeliness and reliability of the information or any results from its use.

no_comments

Looks like there are no comments yet.