


Did you know you can get the Sprott Money Monthly Wrap Ups, Ask The Expert,
special promotions and insightful blog posts sent right to your inbox?
Sign up to the Sprott Money Newsletter here.
This is the current state of play in Gold:
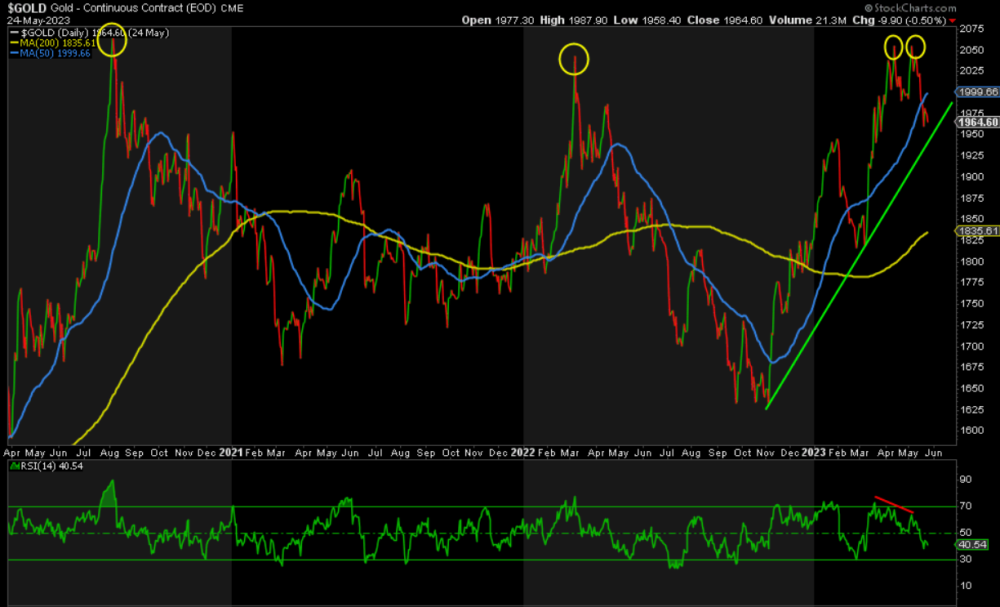
The green trendline support is at 1950 on the daily chart. If we close below there, it’s either a fake breakdown, which would be bullish, or we’re down to lower levels. Alternatively, 1950 holds on a closing basis and we have a potential bottom in place.
The RSI is neither positively divergent nor extreme oversold.
Sentiment remains moderately bullish, which provides no help one way or the other.
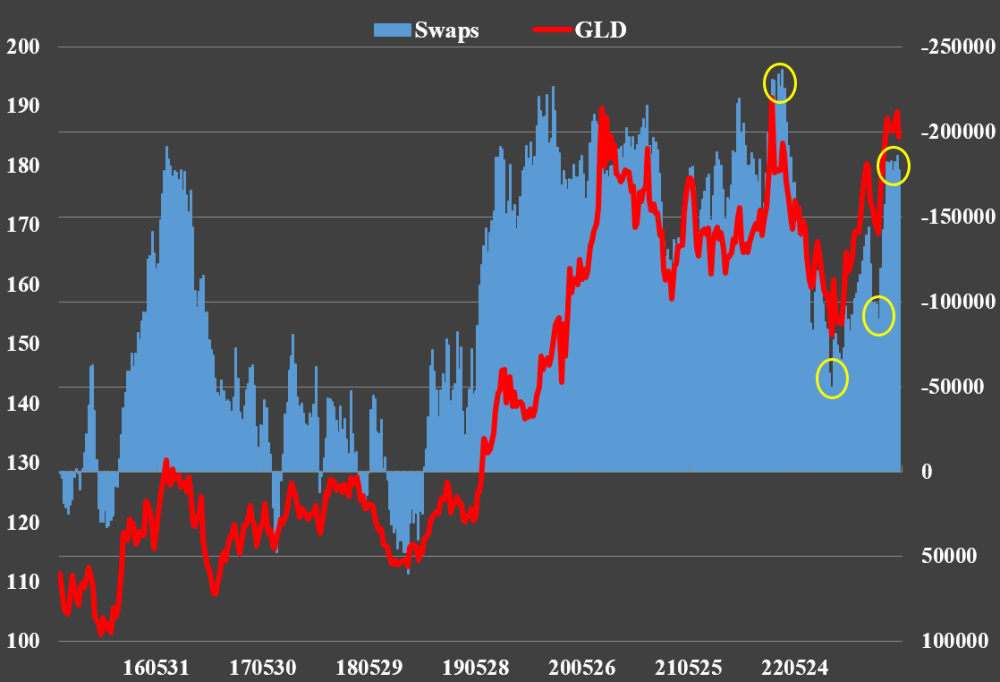
The COT data from last week shows that the Banks are still extremely short on a net basis and a long way from their positions at prior lows in price.
The weekly chart doesn’t help much either:
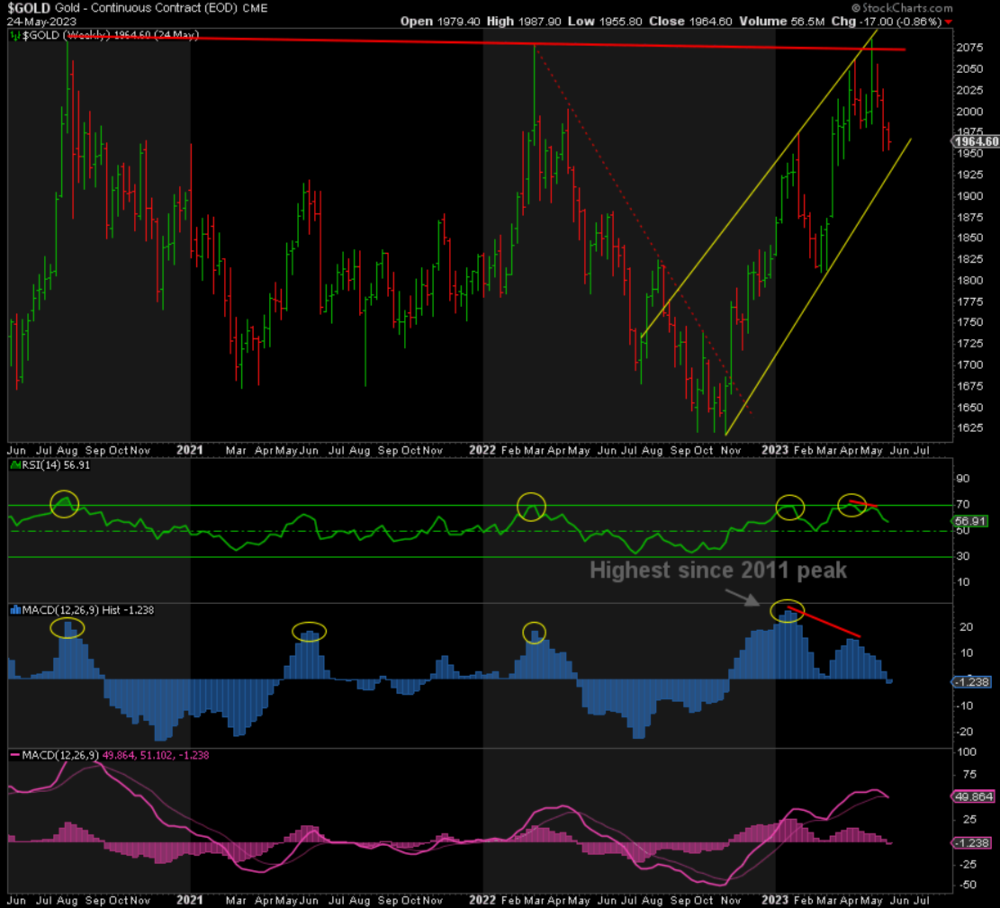
The bottom of the channel, or bear flag, is around 1930-35. The RSI is falling but hasn’t even reached neutral yet. The MACD Histogram has turned negative, and the MACD Line is also heading south.
In summary, while many analysts are turning positive here, there is little to support such optimism. The support levels at 1950 and 1930-35 could provide a short-term bounce or even a bottom, but unless we take out at least 2000, we remain in no man’s land. On the contrary, if these support levels are broken, we could fall to 1900 or even the low 1800s. Only a close above 2055 and a break of the intraday high of 2089 confirms the bottom is in and we’re heading much higher.
With all that said, I firmly believe that a move up to new record highs is inevitable. I remain cautious in the short-term but extremely bullish beyond that.
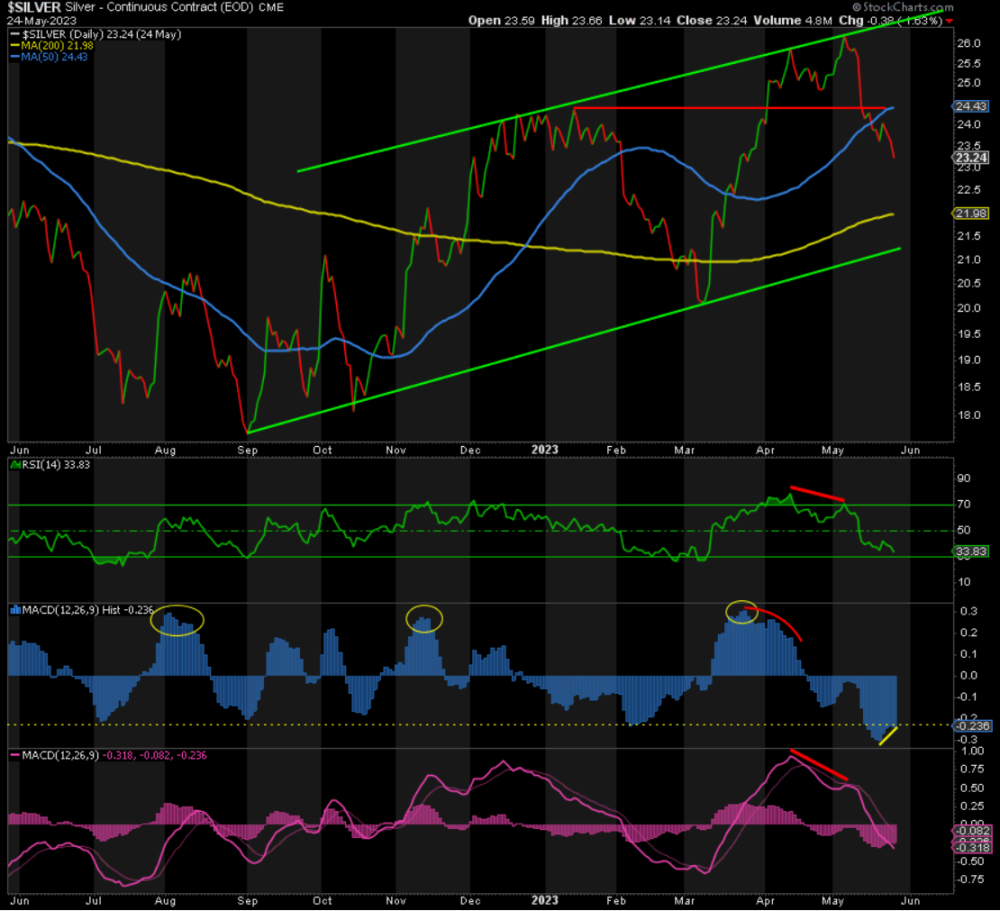
As for Silver, while there is little to suggest that a bottom is in place, there are signs that Silver is closer to one than Gold. The RSI has a 33 handle and is approaching extreme oversold levels. The MACD Histogram is positively divergent, coming off its lowest level since December 2021.
There are multiple support levels all the way down to 20 in Silver, with the 200-DMA and the green support trendline among them. We could get a bounce, but until we break 24.40 or we a get a positively divergent lower low followed by a break of resistance, I remain cautious here too.
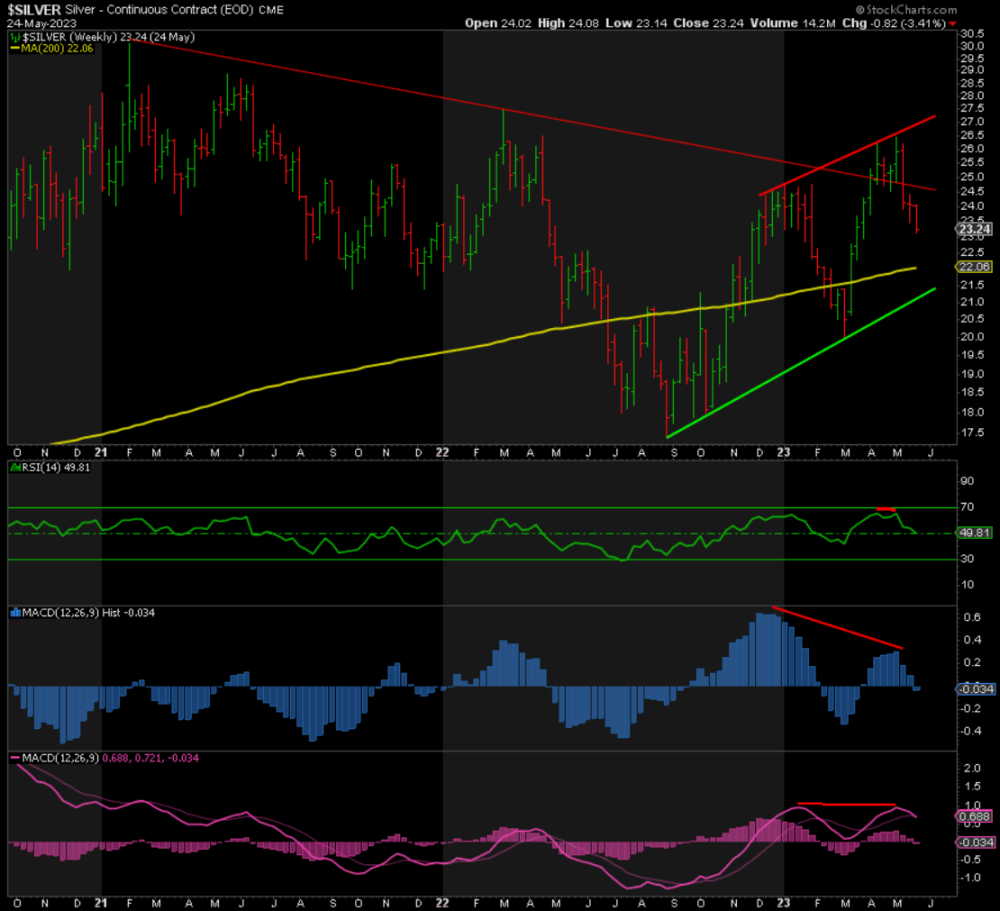
The weekly chart shows that the RSI is neutral. But the MACD Histogram has turned negative. Silver could still fall further to the 200-DMA at ~22 and the rising trendline support at ~21.50.
Meanwhile, bullish sentiment has corrected far more than Gold, but it could still go lower.
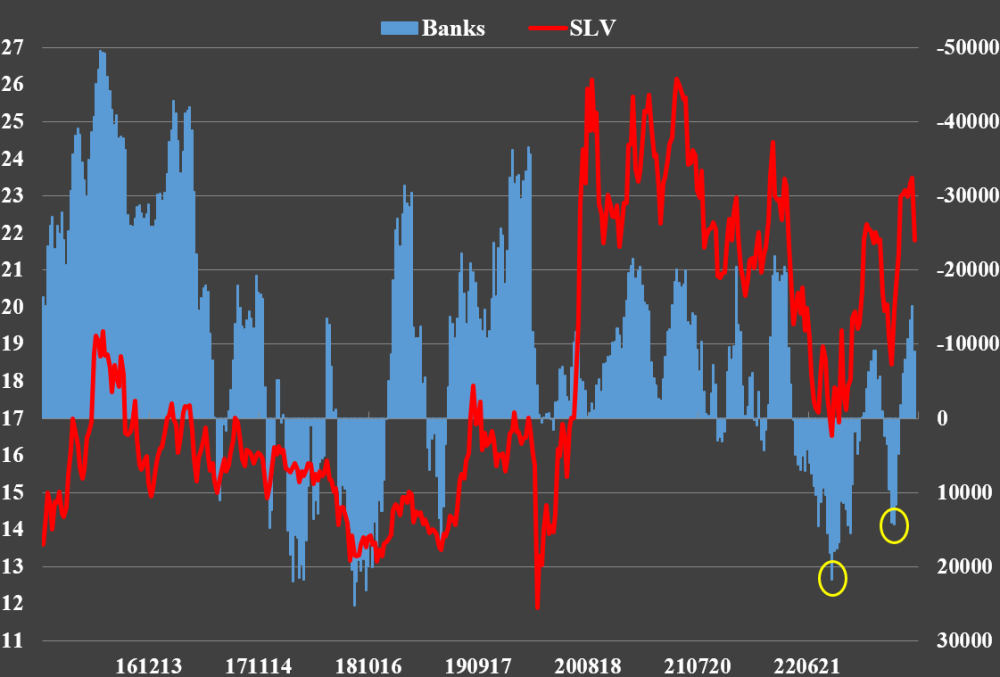
The Banks’ positioning in Silver is not signaling a bottom “yet”, but it is far closer to doing so than Gold.
All-in-all, there is nothing definitive in Silver right now to suggest that a low is in place. I’m waiting for signs of a bottom, perhaps a positively divergent lower low on the daily chart, followed by a break of resistance, preferably 24.40. Until then, as with Gold, I remain cautious on Silver for now.
In conclusion, I remain cautious in the short-term, trimming some positions to build cash to buy a positively divergent lower low or a break of resistance on the upside. While I’m waiting for that, I still believe that the coming low, wherever it turns out to be, will be THE low that won't be broken before new record highs in Gold (or perhaps ever!) and 30+ in Silver.
Don’t miss a golden opportunity.
Now that you’ve gained a deeper understanding about gold, it’s time to browse our selection of gold bars, coins, or exclusive Sprott Gold wafers.


About Sprott Money
Specializing in the sale of bullion, bullion storage and precious metals registered investments, there’s a reason Sprott Money is called “The Most Trusted Name in Precious Metals”.
Since 2008, our customers have trusted us to provide guidance, education, and superior customer service as we help build their holdings in precious metals—no matter the size of the portfolio. Chairman, Eric Sprott, and President, Larisa Sprott, are proud to head up one of the most well-known and reputable precious metal firms in North America. Learn more about Sprott Money.
Learn More
You Might Also Like:

Looks like there are no comments yet.