


For as long as anyone can remember, the most prominent driver of gold prices has not been inflation. That's only half the picture. The actual driver has been inflation-adjusted or "real" interest rates. At least it used to be that way.
Suddenly, in early 2022, the correlation between real rates and gold prices broke down. And not just by a little. It broke down by a wide margin. At my TF Metals Report site, we've been discussing this "miscorrelation" for months but, recently, some mainstream media and analysts have begun to take notice. See this link from Bloomberg that appeared a few days ago: Chinese Gold Buying Is Driving a Paradigm Shift in Bullion.
Analyzing the Correlation: Gold and Real Interest Rates
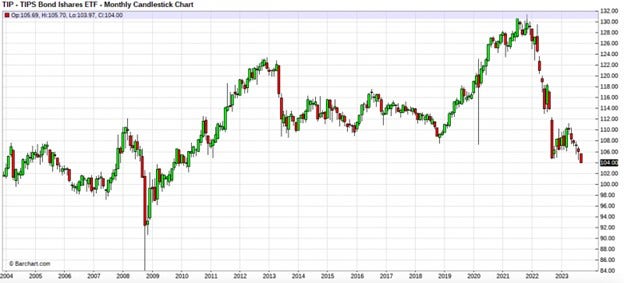
Let's start with some charts. The easiest way to track inflation-adjusted U.S. interest rates in real time is by observing the share price of the "TIP" ETF. This ETF is loaded with Treasury Inflation-Protected Securities (TIPS) and its price moves inversely to real rates. As real rates fall and go negative, the share price rises. Conversely, as real rates move positive and rise, the share price falls.
Below is a 20-year monthly chart of the TIP ETF. Notice that, since the Great Financial Crisis of 2008-2009, the share price has largely risen as real rates fell. It peaked in 2022 and has since fallen sharply as rapidly rising nominal interest rates have turned the inflation-adjusted real rates sharply higher.
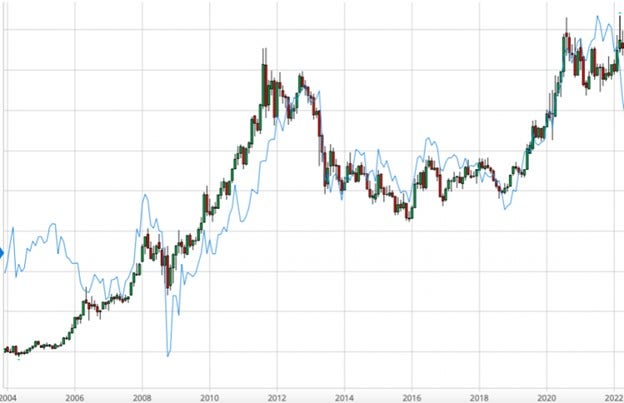
Next, if we plot the TIP ETF with COMEX gold prices you can see the extremely close correlation that held through early 2022. (The COMEX gold price is in candlesticks and the TIP price is displayed as a blue line.)
But look what happens when we add on the prices from early 2022 to present. Note the sharp divergence and "miscorrelation" below.
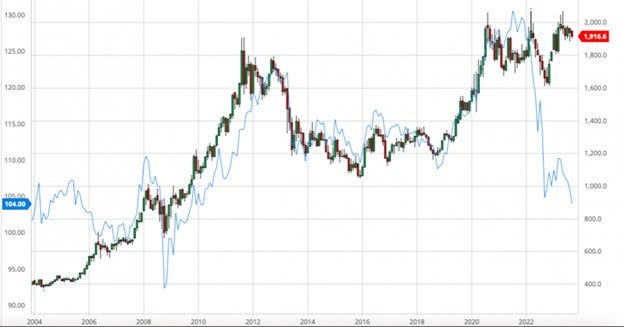
By the looks of that chart, you'd think that COMEX gold is massively overpriced relative to real interest rates. With real rates, as measured by the TIP, at 13-year highs (TIP price lows), you might have expected to see gold priced near $1000/ounce on COMEX. But it's not. Instead, I have a last of about $1935/ounce, which is only about 6% off its all-time highs? What gives?
And that's the question those Bloomberg writers, and many analysts on the internet, are twisting themselves into knots trying to answer! Why would this long-held and reliable correlation suddenly break?
A Historical Overview of the London Gold Pool
I have a different and easy-to-understand answer that you're unlikely to hear from "mainstream" sources, and it begins with a history lesson.
Are you familiar with the London Gold Pool? If not, you should click that link and read all about how eight nations attempted to fix and manage the gold price from 1961-1968. At that time, the gold price was pegged to the U.S. dollar at a ratio of 35 dollars to one ounce of gold. In order to maintain the peg, the eight nations sold physical gold into the market whenever price exceeded $35 and then they bought it back when price fell below $35. This scheme worked great... until it didn't.
By 1968, creditor nations with an ever-increasing supply of dollars began to convert dollars to gold at a pace faster than the eight nations could supply the physical metal. The peg broke, The London Gold Pool collapsed, gold prices soared and, by 1971, U.S. President Richard Nixon was forced to "temporarily suspend" the dollar's convertibility to gold by closing the "gold window". The rest, as they say, is history.
The Introduction of Gold Futures Contracts
But that didn't fix the gold demand problem. There simply wasn't enough physical gold to go around at a price below $100/ounce and, with Great Society spending and a war to finance, the dollar-printing of the U.S. continued to ramp higher. So what was the solution? Alchemy.
Since the Middle Ages, scientists have tried to create gold from other materials and all attempts had failed... until the year 1974. And what happened in 1974? The Bankers created gold futures contracts and began trading them on the COMEX in New York on December 31 of that year. The prohibition on gold ownership by U.S. citizens was set to end on January 1, 1975 and the Bankers feared that this looming boost in physical demand would send gold prices even further skyward. From where would the gold come to meet this demand?
It was simple, the Banker/Alchemists reckoned. Create securities and derivatives that could be treated "as good as gold". Futures contracts would provide price exposure that, until 1974, could only be attained by acquiring physical metal. Later, ETFs and unallocated accounts would further dilute the base of physical metal by offering new ways to gain price exposure without the need for actual, physical metal in the safe.
And, sadly, the investing public bought it. The Banks could now meet physical demand by offering phony-baloney pretend gold. The Banks could also earn fees and commissions from doing so! What a great deal! Further, these banks (called Bullion Banks) could manage and manipulate price for their own benefit through the markets of London and New York. They had the metal and they knew where the orders were. This gave them an almost monopolistic control over what had become a fractional reserve and digital derivative pricing system. The investing public was satisfied with relative ease of the price exposure the Bullion Banks provided and the Bullion Banks made easy and consistent profits.
However, just like the London Gold Pool, this scheme can work great... until it doesn't. And what can collapse the system? That old bugaboo of physical demand.
Gold Market Equilibrium: Balancing Price and Physical Demand
You see, for the price "discovered" through the trading of derivatives to be relevant, there must be physical metal delivered at that derivative price. You can say your price is $1900/ounce but, if you can't deliver any actual physical metal to a buyer at that price, then your $1900 price is garbage. It's meaningless. Got it?
OK. So now, armed with the knowledge of what you just read, we're ready to discuss the recent "miscorrelation" between real interest rates and the COMEX gold price.
Let's look again at that chart of the TIP and COMEX gold. If the simple correlation had held through 2022 and beyond, what would we expect the London/NY derivative gold price to be here in late 2023? $1200? $1000? Maybe less?
So, why is price still north of $1900? Well, that's simple, isn't it? Because the Bullion Banks, who retain control of the London and New York markets, are still required to flow physical metal at the digitally derived price. To me, it's obvious that these Banks KNOW that there is zero physical metal available as prices fall. If they allow the derivative price to fall to $1200, then they are on the hook to flow physical metal to buyers at $1200/ounce. As such, if they allow the derivative price to fall as far as real rates might indicate it should, they risk breaking the market scheme from which they've profited so handsomely for nearly 50 years!
But wait, you say! The LBMA claims that the London markets are backed by thousands of tons of physical metal. Oh really, I say! The vast majority of LBMA-vaulted gold is owned by the Bank of England or pledged to the multitude of gold ETFs that have appeared over the past two decades.
Ronan Manly’s analysis of LBMA gold vault data reveals that, in 2017, the LBMA reported a total of 7449 tons of stored gold. However, taking into consideration the amount of gold stored in the Bank of England or tied to gold-backed ETFs, it is revealed that only approximately 858 tons of gold were actually stored in the LBMA vaults.
Again, it is imperative that you understand this simple point. If the Bullion Banks fail to flow physical metal at the price derived via the trading of derivatives, then their entire pricing scheme collapses. With global central bank and investor demand at multi-decade highs, the Bullion Banks know that a falling digital price will only serve to drive even greater physical demand. Their primary challenge in 2023 is to maintain an equilibrium where enough physical supply can be found to deliver on a daily basis. A sharp drop in price, and a concurrent spike in demand, could potentially destroy that equilibrium.
CFTC Commitment of Traders Reports: Insights Into Gold Price Trends
Anecdotal "proof" of this can be seen in the weekly CFTC Commitment of Traders reports. If the Bullion Banks, recognized as "Swap Dealers" on the disaggregated reports, were happy to see price fall, they'd simply stand down and allow the speculating Hedge Funds to short price all the way to $1000/ounce. But that's NOT what they're doing. Instead, on every price dip, and as the Hedge Fund short position grows, the Swap-Dealing Bullion Banks COVER SHORTS AND ADD LONGS. By doing so, the Banks create a floor for price. Last year, and as we wrote on multiple occasions at the time, that price was clearly near $1650 for COMEX gold and $19 for COMEX silver. In 2023, those price floors have been closer to $1900 in COMEX gold and $23 in COMEX silver.
Read more: The Next Silver Price Short Squeeze
Now this isn't to say that the price of COMEX gold can't fall a little from here. If a price drop to $1800 brings enough retail investor capitulation that the Bullion Banks are able to pillage some physical metal from the GLD... for which they are "Authorized Participants" and the only parties allowed to withdraw metal... then maybe the Banks can shake loose enough of that ETF's gold to flow into the sovereign and institutional physical demand that would undoubtedly emerge on the price drop? Maybe.
However, that's taking an awfully large gamble on investor sentiment. If retail price exposure (ETF) demand remains firm on future price drops, the only remaining tool the Banks would have would be to naked short some ETF shares and then withdraw the metal. That would seem to be a very risky strategy at the current time, and it seems an unlikely path for the Bankers to pursue.
The Current Gold Price: Factors Defying Historical Expectations
And so, in conclusion, here we sit. The gold price remains above $1900/ounce even though the historical relationship between price and real interest rates suggests it should be half as much. Mainstream journalists, pundits, and analysts remain puzzled by the sudden "discorrelation" between real rates and gold. My hope, however, is that after reading this column, you now grasp the most likely explanation behind this new gold market dynamic.
Did you know you can get the Sprott Money Monthly Wrap Ups, Ask The Expert,
special promotions and insightful blog posts sent right to your inbox?
Don’t miss a golden opportunity.
Now that you’ve gained a deeper understanding about gold, it’s time to browse our selection of gold bars, coins, or exclusive Sprott Gold wafers.


About Sprott Money
Specializing in the sale of bullion, bullion storage and precious metals registered investments, there’s a reason Sprott Money is called “The Most Trusted Name in Precious Metals”.
Since 2008, our customers have trusted us to provide guidance, education, and superior customer service as we help build their holdings in precious metals—no matter the size of the portfolio. Chairman, Eric Sprott, and President, Larisa Sprott, are proud to head up one of the most well-known and reputable precious metal firms in North America. Learn more about Sprott Money.
Learn More

You Might Also Like:

Looks like there are no comments yet.