


The trend of higher lows and higher highs in Gold has been going on since November 2022 when it bottomed at $1618. It is now at $2905, a gain of 80%. It may still have more upside yet to $3000, which would match the gain in wave 3 from $1124 to $2089. It could go even higher than $3000.
Stating the obvious, these gains are huge! But the trend is your friend until it isn’t.
However, such massive moves typically signal extreme overbought conditions.
Gold Price Analysis on Daily Chart
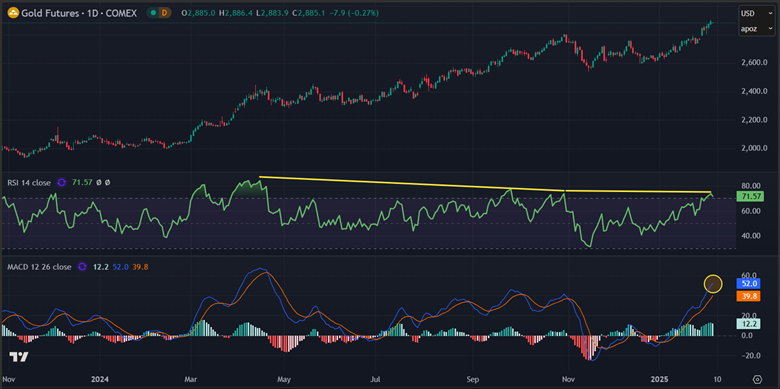
Gold Futures
The RSI is currently at 72, which is extreme overbought. However, it has been even more overbought prior to this, with RSI levels of 74, 78, and 84. These higher highs are all negatively divergent also.
The MACD Line is going up, and it can go further, but it too is negatively divergent.
This also looks like a wave 5 top is developing, which means that the next big move will be to the downside.
In the meantime, Gold can continue to higher highs, perhaps even a blow-off top, but the laws of gravity will kick in sooner or later. $3000 is a nice round figure for a major peak.
Weekly and Monthly Gold Chart Signals

Gold Futures
The weekly chart is also extreme overbought and negatively divergent. There are clear divergences in both MACDs too.
We are seeing such overbought conditions across all timeframes, many with negative divergences as well, ahead of strong resistance and following a massive rally.
Monthly Chart
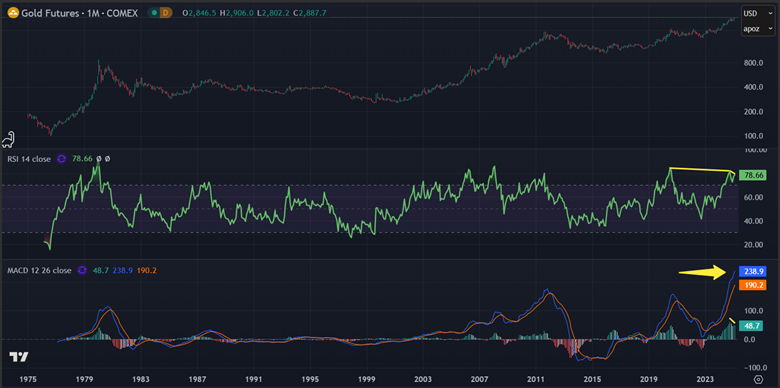
Gold Futures
This monthly chart goes back to 1978. The MACD Line has never been higher. I don’t know how much higher it could go, but the MACD Histogram is already turning down, and when the MACD Line follows, look out below.
The MACD Line is far higher than it was in 1980, when Gold peaked at $800 and rose 24x in just six years. It is far higher than the peak at $1923 in 2011. It is way above the peak of $2089 in 2020. When this falls, run for the hills.
The RSI is extreme overbought also and negatively divergent. This doesn’t bode well either.
SENTIMENT is extreme bullish too. Could it become even more bullish? Sure! Especially in a wave 5 and blow-off top scenario.
Gold and Silver Positioning
The Banks remain excessively short, as do the Funds on the long side. They both started cutting their positions last week but only in minimal amounts. When they do cut their positions on a regular basis and in size, that is when the price starts to head south.
Fundamentals Impacting Gold and Silver
As for the Trump tariffs on multiple countries, they could include Gold and Silver, hence the race to buy those metals ahead of the tariffs, driving prices higher. But the tariffs have been delayed with Mexico and Canada for now, two of the biggest producers of precious metals in the world. Tariffs on Chinese exports don’t impact Gold because China prohibits the export of the metal. Then there are potential carve-outs for Gold and Silver. Should the tariff narrative lose its lustre at any time in the near future, expect a sizeable correction. Until then, the trend can continue even higher.
One thing is for sure, nothing goes up in a straight line forever. Case in point since this rally began in December 2015 at $1045:

Gold and Silver Investment Strategy
At the risk of repeating myself, as long as the trend continues higher, Gold could go to $3000 or beyond. But if Gold falls back below $2800, a lower low, then that is a warning that the trend is turning down. Following a rally of 80% from $1618 in October 2022, expect a big correction.

Gold Futures
Silver Price Analysis
Daily Chart

Silver Futures
Like Gold, Silver is trending upwards but with nowhere near the level of gusto as Gold. It broke out to the upside of its bull flag, but if it turns back down again, it will have been a fake breakout, and that is bearish.
The 50-day moving average is still below the 100-day moving average, which is bearish, and the 200-day moving average is not far away either.
There are multiple negative divergences in the RSI going back as far as April 2024. There are also multiple negative divergences on the MACD Line. The MACD Histogram is also negatively divergent.
SENTIMENT in Silver, like Gold, is extreme bullish, but it could get even more bullish. In that case, say hello to the cliff edge.
Positioning and Strategy for Silver
Like Gold, the Banks have begun cutting their massive short position in the past week. If this continues, watch the price of Silver fall. The Funds are also cutting their longs, another sign that there is a major peak coming.
Silver Investment Strategy

Silver Futures
A break below $31.70 would be a lower low. This would signal trouble for Silver. Until then, Silver can go higher in the short term.
Conclusion
While Gold and Silver continue to trend higher in price, the data is becoming overwhelmingly bearish. While we can’t time the exact top, we can watch for lower lows, and when those occur, the risk-reward is decidedly down.
Buy gold and buy silver today to secure your financial future.
Don’t miss a golden opportunity.
Now that you’ve gained a deeper understanding about gold, it’s time to browse our selection of gold bars, coins, or exclusive Sprott Gold wafers.


About Sprott Money
Specializing in the sale of bullion, bullion storage and precious metals registered investments, there’s a reason Sprott Money is called “The Most Trusted Name in Precious Metals”.
Since 2008, our customers have trusted us to provide guidance, education, and superior customer service as we help build their holdings in precious metals—no matter the size of the portfolio. Chairman, Eric Sprott, and President, Larisa Sprott, are proud to head up one of the most well-known and reputable precious metal firms in North America. Learn more about Sprott Money.
Learn More
You Might Also Like:

Share: