


Gold Prices
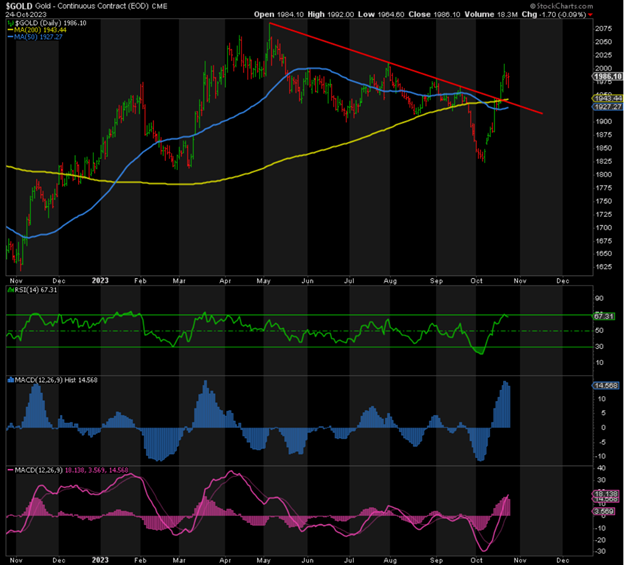
Gold did not close above 2000!
Daily RSI peaked at 71. MACD H also peaked, which signals risk is down.
Possible back-test to red trendline in the 1930s. 200-DMA ahead of that at 1943. Then up it goes to test and break 2009.
However, a break back below both would signal a fake breakout, which is extremely bearish.
By contrast, a close above 2009 would set up a test of 2085, but it’s unlikely given the overbought condition.
It did set a higher high above 1970, so the trend would change if we get a higher low anywhere above 1824.
Is wave i of 3 complete and wave ii down underway? Or is wave i not done yet and heading higher to 2085 directly? Or are we heading down to a lower low in wave v of (2)?
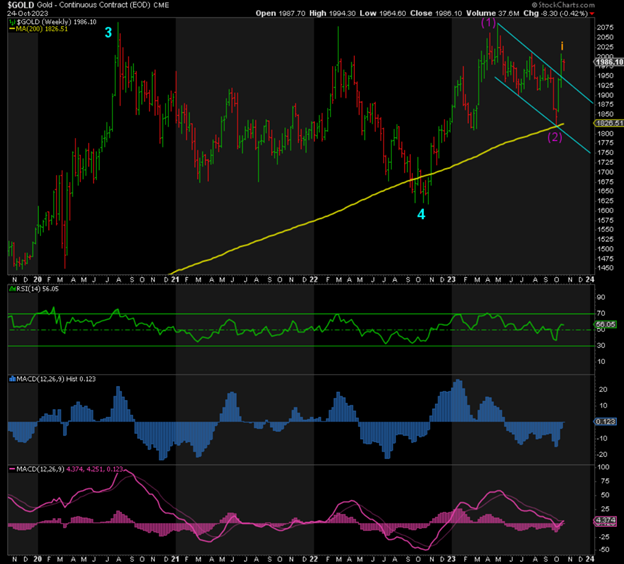
Weekly chart shows solid support at 1824. So, a break there would truly weed out all of the weak holders and virtually guarantee a massive rally to follow.
Weekly chart is basically neutral based on RSI and MACD indicators. Gold could go either way.
All depends on whether wave i continues higher or turns down to a higher low or lower low.
SENTIMENT
Moderately bullish, but it may have risen too far, too fast, justifying a short-term reversal.
POSITIONING
Funds increased their net long position by 42k contracts in one week, the biggest one week jump since March when Gold peaked at 2085 and went south until Oct 5. Given that the price rose after this data, the Funds probably added even more longs.
The same goes for Banks and Commercials on the short side. They have likely added to their shorts as Gold rose above 2000. This doesn’t bode well in the short-term.
There is a key difference here, though. The Funds were much longer and the Banks/Commercials much shorter back in March than they are now.
But it does raise concerns of a deeper dive in price nonetheless.
Banks are clearly trying to cap Gold in the short-term using paper contracts.
INTER-MARKET ANALYSIS
DXY
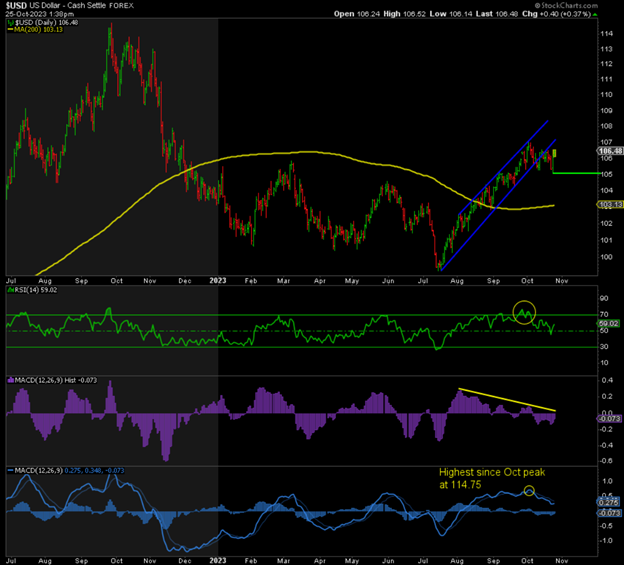
The DXY is setting up for a negatively divergent higher high here.
Break of support at 105.10 signals the top is in and down we go.
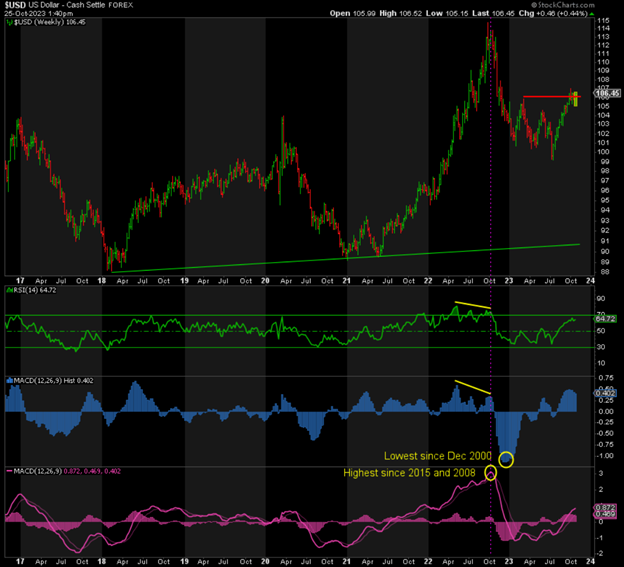
One more pop likely in DXY so that the weekly RSI can tag or slightly rise above 70, becoming extreme overbought.
BONDS / TLT
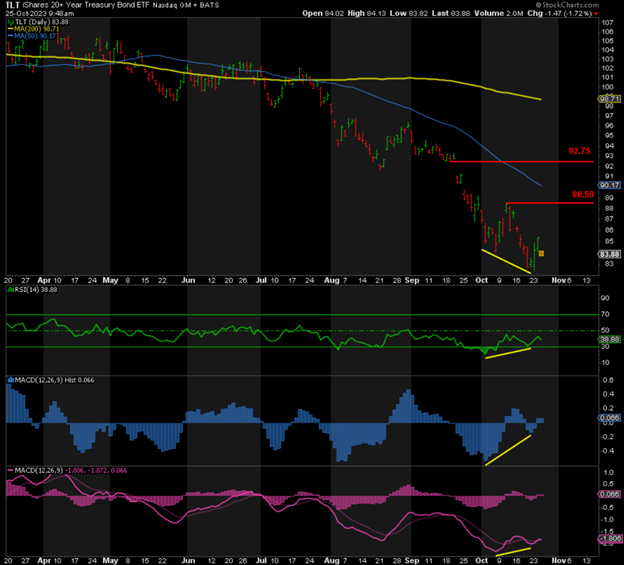
It sure looks like the bottom is in for TLT, thanks to multiple positive divergences at the low of 82.42, which coincides with the 5% peak in the 10-Year Treasury Yield. The RSI and MACDs are also coming off extreme oversold levels.
That said, first we need to take out resistance at 88.50 to establish a higher high. Then, following a short-term reversal to a higher low, break 92.75 to confirm the bottom is in.
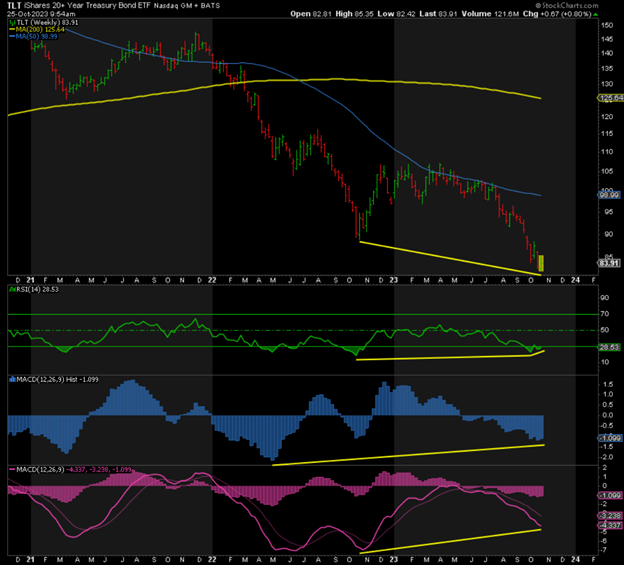
The weekly chart confirms what the daily chart is showing. Multiple positive divergences here point north for bond prices, meaning lower yields.
Precious Metals Prices Fundamentals
I don’t put a lot of faith in safety trades such as the Israel-Hamas war. They tend to be short-lived.
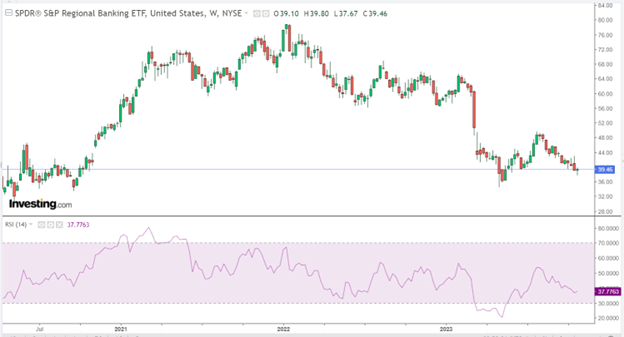
However, stress in the banking system continues, and if we see any headlines announcing another bank failure, expect Gold to go much higher, as it did in March. In my opinion, the next banking crisis is inevitable.
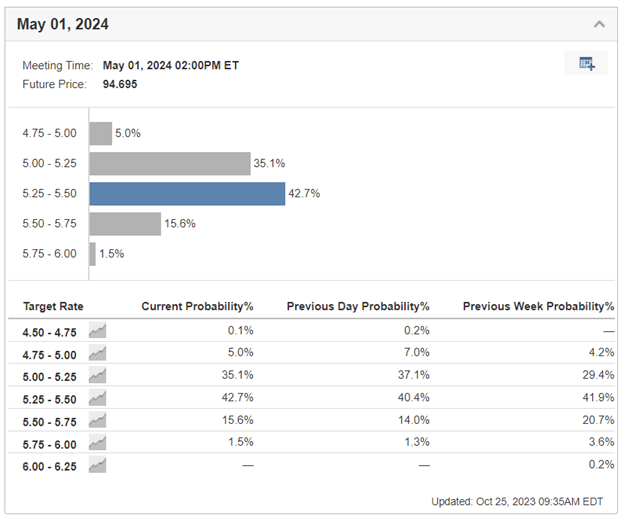
As for Fed policy, Powell and his colleagues have been relatively clear that the top in rates is in but will remain higher for longer. Of course, they leave themselves open to another rate hike if warranted, but the market clearly believes the Fed’s tightening cycle is done:
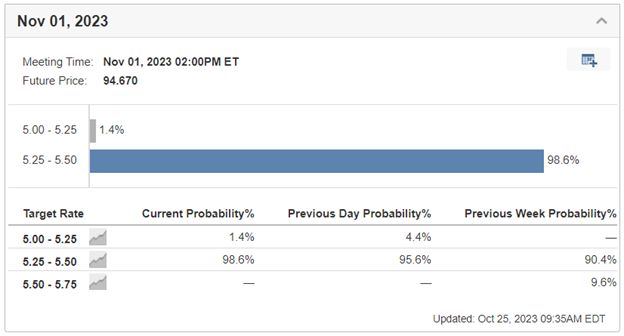
In fact, the market favors a rate cut next, but not until May 2024 at the earliest.
Other than price and sentiment shooting higher, perhaps too far, too fast;
Funds are racing to get long at the fastest pace since the peak in March at 2085, and the Banks are doing the same on the short-side;
DXY looking like a negatively divergent higher high is increasing in probability;
And who knows what happens next in the Israel-Hamas conflict or ‘when’ the next bank goes bust?
This suggests we get a short-term pullback at most, perhaps to a higher or lower low.
By contrast, it looks like bond yields have peaked, and if this is true, the path forward for Gold, beyond the short-term, is extremely bullish.
Simply put, when bond yields peak, pullback aside, Gold is going much, much higher.
The only caveat is an all-out meltdown in the stock market. Even if that happens, the effect on Gold will be relatively short but sharp, much like in 2008, and expect the Fed to open the floodgates of liquidity one more time, sending Gold towards 3000.
Silver Prices
As always, almost everything that affects Gold impacts Silver. So, I won’t be repeating the aforementioned points.
According to the Gold:Silver ratio, or “GSR”, Gold has broken out to the upside:
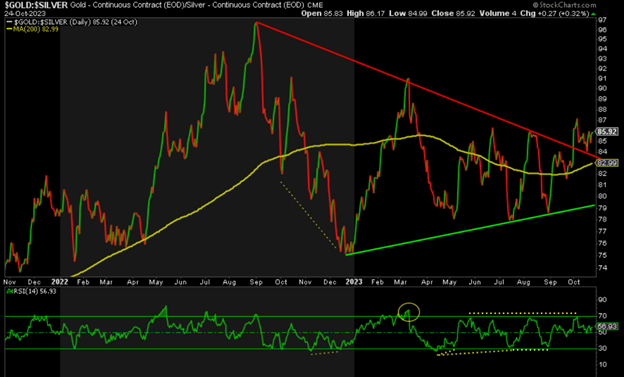
However, it remains in a long-term downtrend since the peak in September 2022. I still strongly believe that when Gold takes off, Silver will crush Gold in terms of performance to the upside, and miners even more so.

Silver broke back above the lower trendline and the 200-Day Moving Average but only for one day. It is back below both. Noticeably, it closed at a peak of 23.50 and then turned down. It needs to close above resistance at 23.50 and, more importantly, 24 to begin its assault on 30 next.
In the meantime, the risk is now down to 22.50 or 22. Worst-case is 18.50, imho. But even if that happens, I fully expect that to be the low, and once we close above 24, 30 is a given, imho.
I am not going to short anything here but simply ride out any further downside, given what happens next.
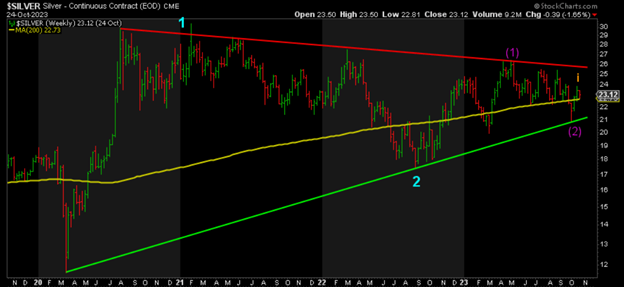
A few quick comments on the weekly chart. The RSI and MACDs are basically neutral, telling us nothing. However, the green trendline remains support since Silver bottomed in March 2020 in the $11 zone. Silver has held that support and broken the 200-Week Moving Average, which is now acting as support. Resistance on the weekly chart is around 25.43, the prior peak.
GDX
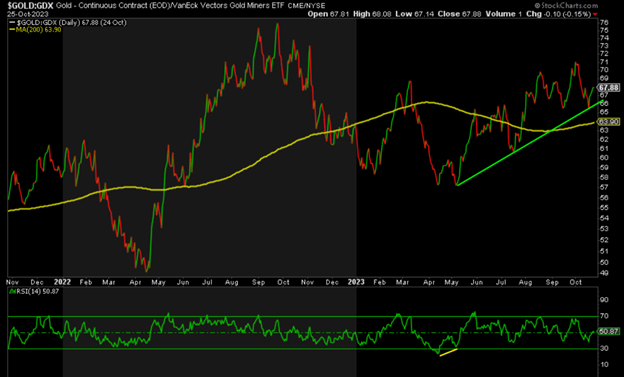
The Gold:GDX ratio shows that the miners have underperformed Gold since the peak in May. But if we close below that green trendline and take out the prior low, I expect the miners to turn the tables on Gold going forward.
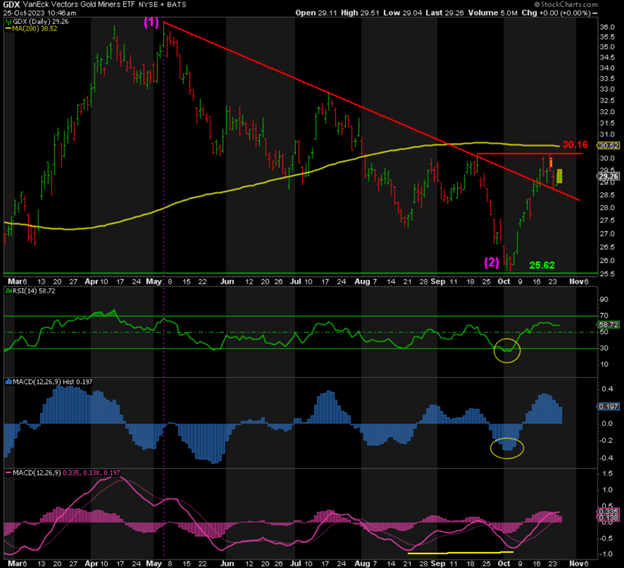
As for GDX itself, it made a marginal higher high above the prior peak of 30.13, but it stalled at 30.16 nonetheless and fell short of the 200-DMA. Now the trendline from the peak in May is acting as support. Should we break back below that trendline around 28.50 currently, it could signal a fake breakout to the upside, which is typically bearish. This would open up the possibility of an even lower low, below 25.62.
Ahead of that, my targets on the downside are 28 or 27, closing the gap left behind on the daily chart and completing a standard A-B-C correction in wave ii.
By contrast, if and when we take out 30.16, and more importantly the 200-DMA, we’re likely to be off to the races to test the May peak next.
Conclusion on Gold and Silver Prices
- SHORT-TERM: Every wave 1 is followed by a reversal in wave 2. Whether we head higher first or go lower, we will get a second wave down. It may already be underway.
- BIG PICTURE: Once we bottom next and take out the resistance levels I’ve provided, the truly spectacular rally we have been waiting for will begin. At that point, just sit back and enjoy the ride.
The only caveat to this outcome is a stock market crash. In order for that to happen, I need to see the 10Y-2Y yield turn positive. But even then, it would be a sharp but short drop in the metals and miners, like in 2008, and then we head north, imho.
Simply stated, we’re going much higher in the weeks and months ahead, regardless of where we bottom out first.
Don’t miss a golden opportunity.
Now that you’ve gained a deeper understanding about gold, it’s time to browse our selection of gold bars, coins, or exclusive Sprott Gold wafers.


About Sprott Money
Specializing in the sale of bullion, bullion storage and precious metals registered investments, there’s a reason Sprott Money is called “The Most Trusted Name in Precious Metals”.
Since 2008, our customers have trusted us to provide guidance, education, and superior customer service as we help build their holdings in precious metals—no matter the size of the portfolio. Chairman, Eric Sprott, and President, Larisa Sprott, are proud to head up one of the most well-known and reputable precious metal firms in North America. Learn more about Sprott Money.
Learn More
You Might Also Like:

Looks like there are no comments yet.